
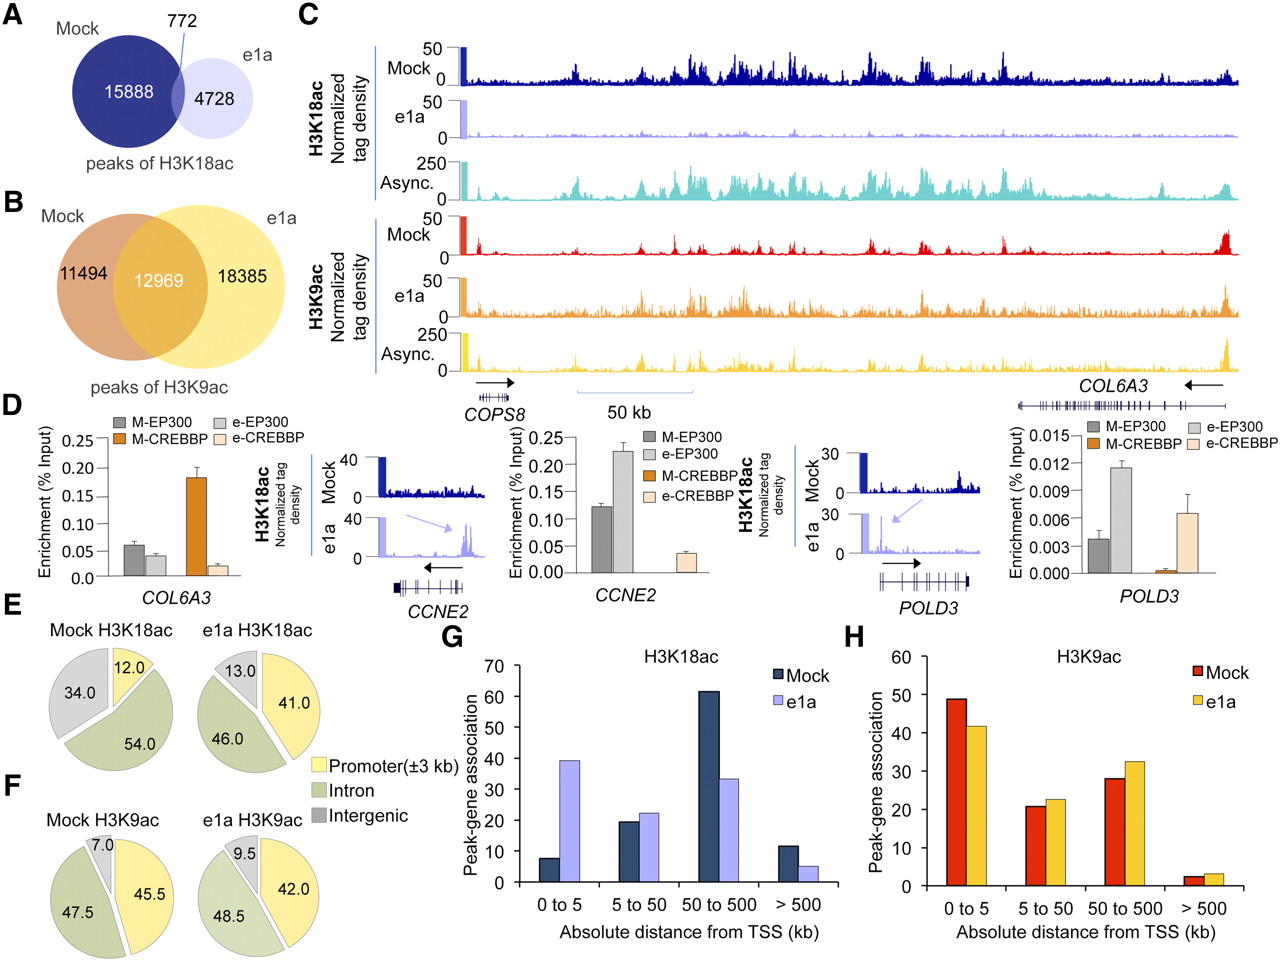
Small e1a causes global deacetylation and redistribution of H3K18ac. (A) Venn diagram showing the overlap between significant peaks of H3K18ac in mock- (dark blue) and dl1500-infected cells (light blue). (B) Venn diagram showing the overlap between significant peaks of H3K9ac in mock- (dark orange) and dl1500-infected cells (yellow). (C) Patterns of H3K18ac and H3K9ac in the intergenic region between COPS8 and COL6A3 genes in mock-, dl1500-infected, and asynchronous IMR90 cells. (D) Quantitative PCR (% of input) for EP300 and CREBBP in mock- and dl1500-infected cells for the COL6A3 intergenic region, and CCNE2 and POLD3 promoters are shown as bar plots. Patterns of H3K18ac in mock- and dl1500-infected cells at CCNE2 and POLD3 loci are also shown. For each histone modification, the y-axis indicates the number of input-normalized ChIP-seq reads across the locus (x-axis). (Light blue arrows) New peaks of acetylation in e1a-expressing cells. (Dark arrows) Direction of transcription. (E,F) Overview of distribution of H3K18ac and H3K9ac peaks in mock- and dl1500-infected cells in relation to gene structure are shown as pie charts. (G) Distribution of significant peaks of H3K18ac with respect to TSS in mock- (dark blue) and dl1500-infected (light blue) cells. (H) Distribution of significant peaks of H3K9ac with respect to TSS in mock- (dark orange) and dl1500-infected (yellow) cells.


