
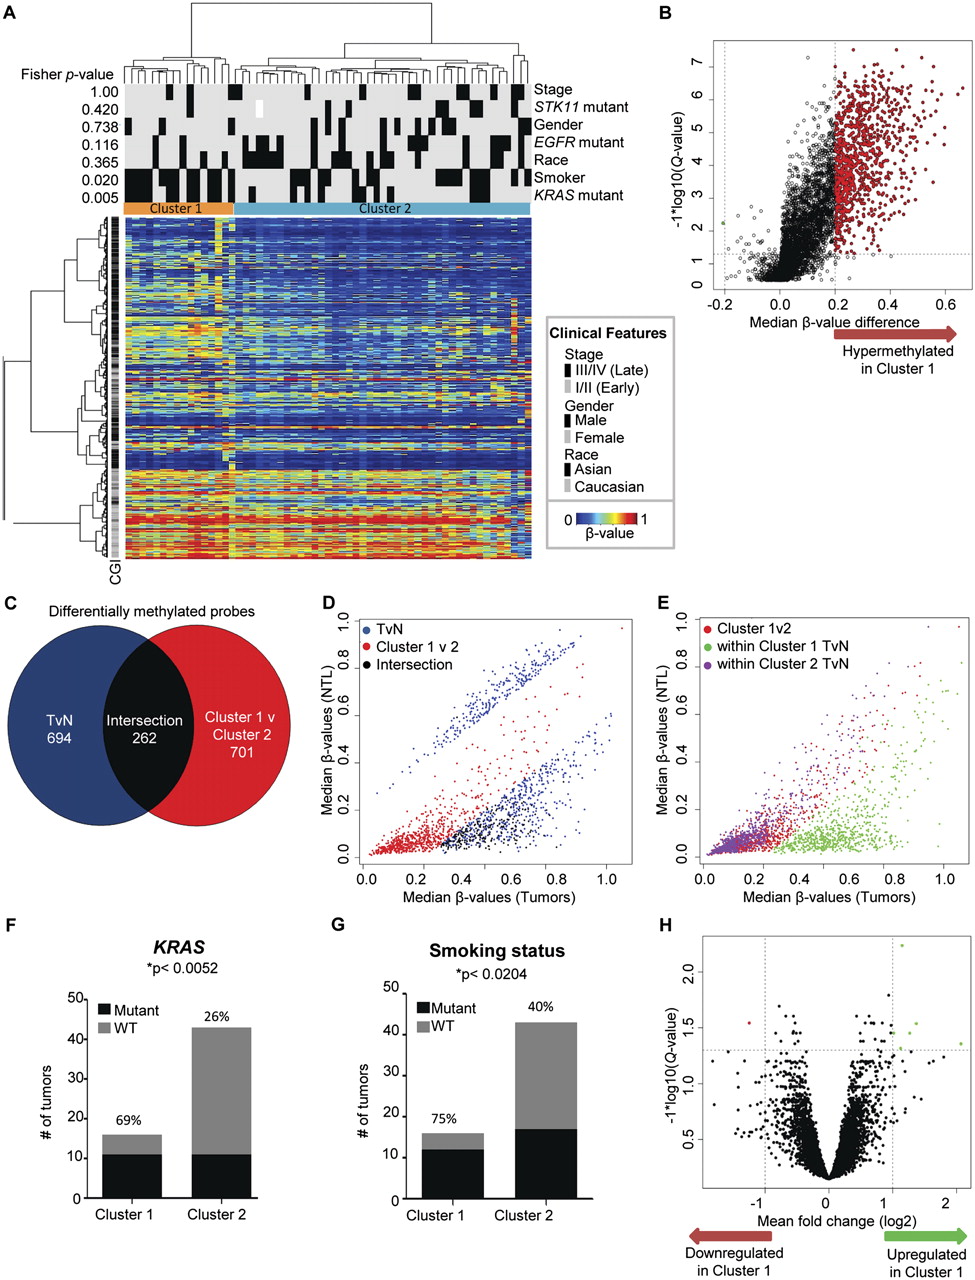
Hierarchical clustering of tumors identifies two distinct DNA-methylation based clusters. (A) Two-dimensional hierarchical clustering of the top 5000 most variant probes among 59 tumors. Rows are probes; columns are samples. Fisher P-values for different sample parameters are shown on the left; parameters are indicated at right (the listed characteristic is marked as a black tick mark, except as indicated in the key beside the heatmap). The two main clusters are marked in color at the top of the heatmap. (B) Volcano plot showing statistically significant DNA methylation alterations between the two clusters. (Vertical dotted lines) 20% change in β-values; (horizontal dotted line) the significance cutoff. (C) Overlap of probes hypermethylated in all tumors vs. NTL and probes hypermethylated in Cluster 1 vs. Cluster 2. (D) Correlation matrix of median β-values of tumors vs. NTL for the three color groups indicated in C. Note that probes that were differentially methylated in Cluster 1 but had not been identified as differentially methylated in the all tumor vs. all NTL comparison (red dots) fell near the diagonal. (E) Correlation matrix of median β-values of tumors vs. NTL for probes differentially methylated between clusters but not between all tumors vs. NTL (red dots in C). The distribution seen when these probes are examined in either Cluster 1 (green dots) or Cluster 2 (purple dots) samples. Note that within Cluster 1 samples, these probes are hypermethylated in tumors. (F) Associations of cluster membership with KRAS mutation status and (G) smoking status. (H) Volcano plot showing statistically significant gene expression differences (unrelated to DNA methylation) between the two clusters. (Vertical dotted lines) A twofold change in expression; (horizontal dotted line) the significance cutoff.


