
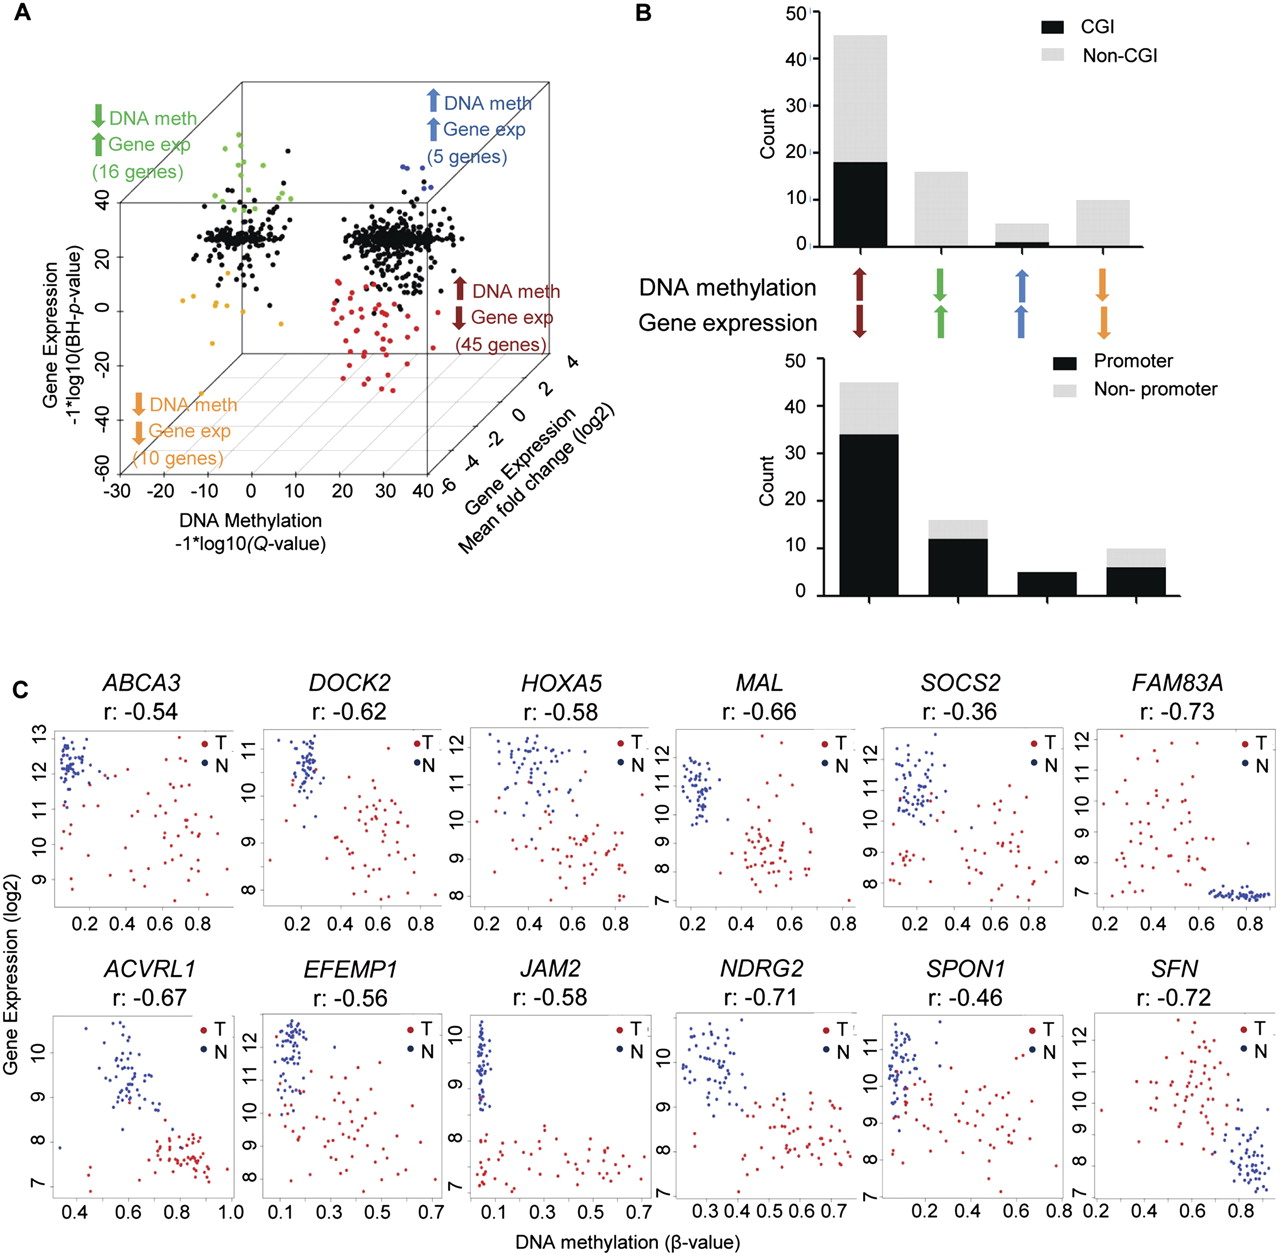
Figure 3.
Genes showing the most significant changes in DNA methylation and gene expression. (A) Three-dimensional starburst plot of 709 genes, integrating significant changes in DNA methylation (x-axis) and gene expression (z-axis), with a mean twofold or greater change in gene expression (y-axis). Colors are as in Figure 2B. (B) Presence of CpG islands and probe locations for genes exhibiting hyper- or hypomethylation and up- or down-regulation. (C) Correlation plots of DNA methylation vs. gene expression in tumors and normal tissues for select genes.


