
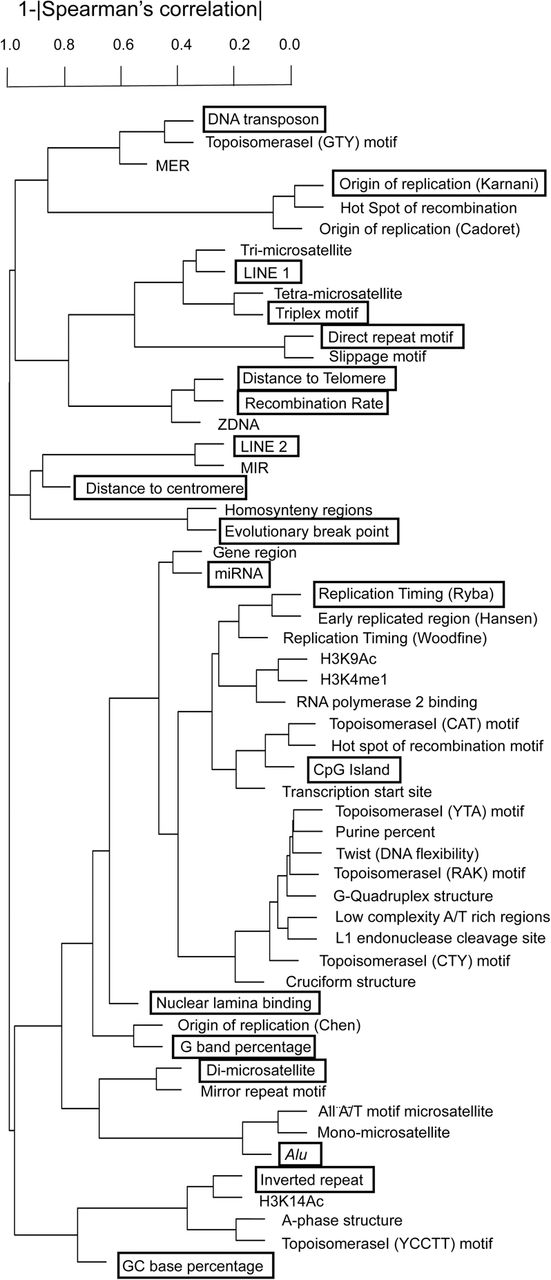
Figure 3.
Hierarchical clustering of predictors using their Spearman correlation coefficients computed across all 73 aCFSs+117 NFRs. (Y-axis) 1–|correlation coefficient|. The lower predictors merge in the dendrogram, the higher their correlation. Predictors in black boxes were selected as potential predictors to run our regression analysis (which includes further predictor selection steps).


