
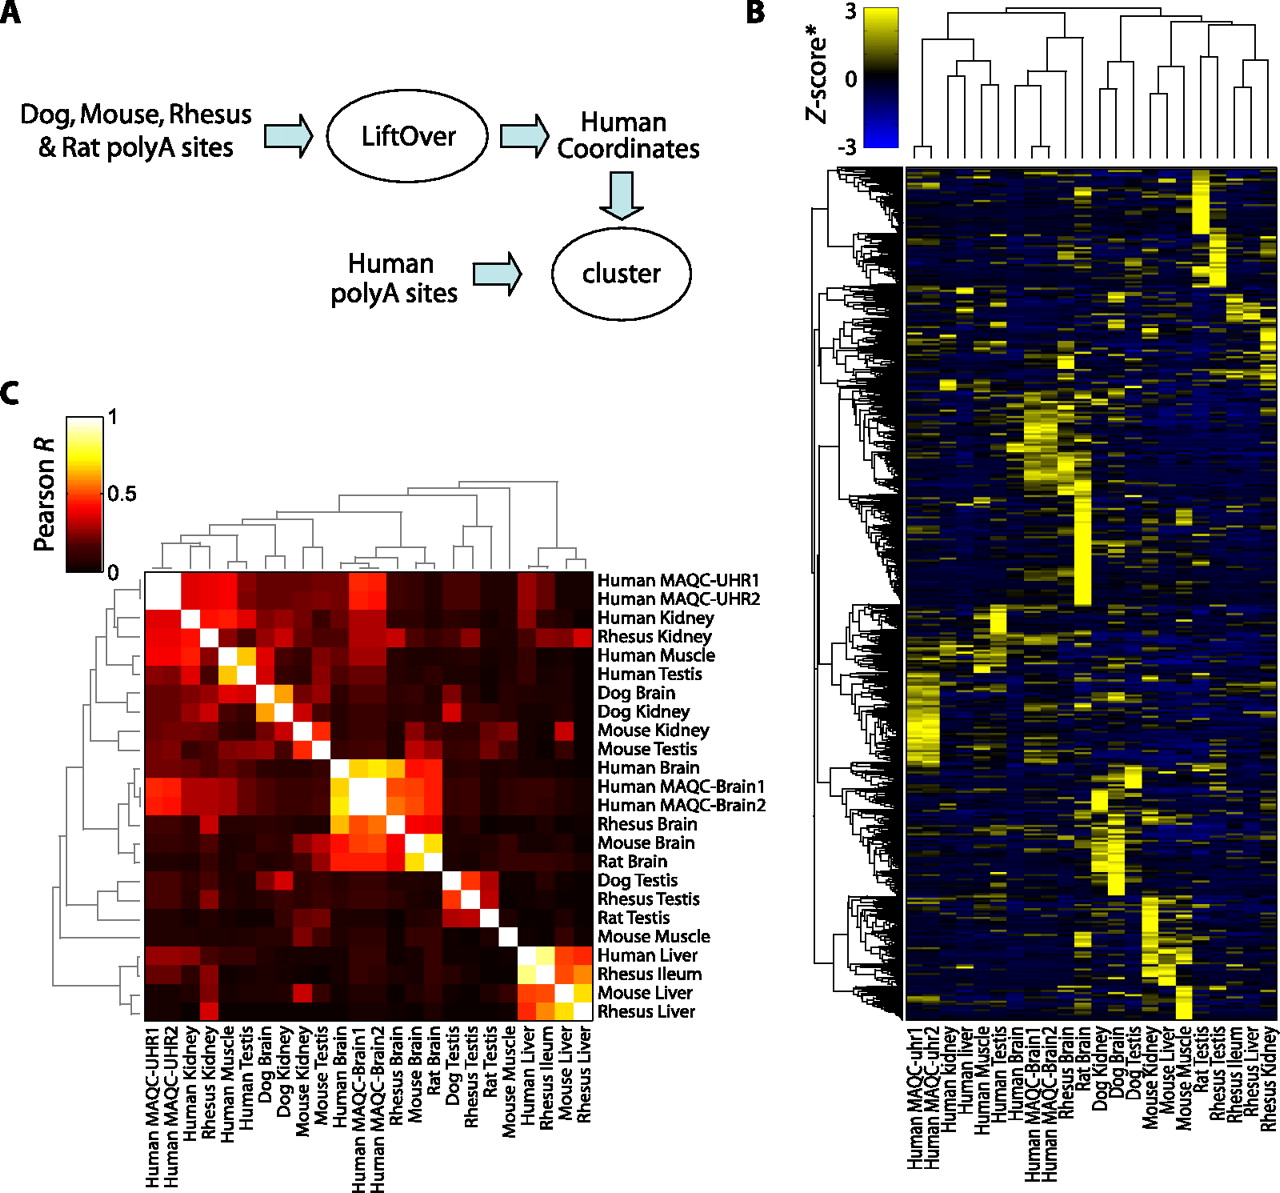
Evolutionary conservation of polyA site usage. (A) Nonhuman polyA sites were transferred to human coordinates (see Methods), combined with human polyA sites, and clustered. (B) 2D clustering of 2590 orthologous sites detected in at least one sample in each species based on polyA site usage/expression. PolyA site expression was normalized to Z-scores (standard deviations away from mean) within each sample. (C) 2D clustering of Pearson correlation coefficients between all pairwise sample combinations. Most samples exhibit higher correlation with cognate samples in other species than with samples in the same species (e.g., brain, liver, and testis). All clustering was performed hierarchically using Pearson correlation as a measure of distance and average linkage for grouping.


