
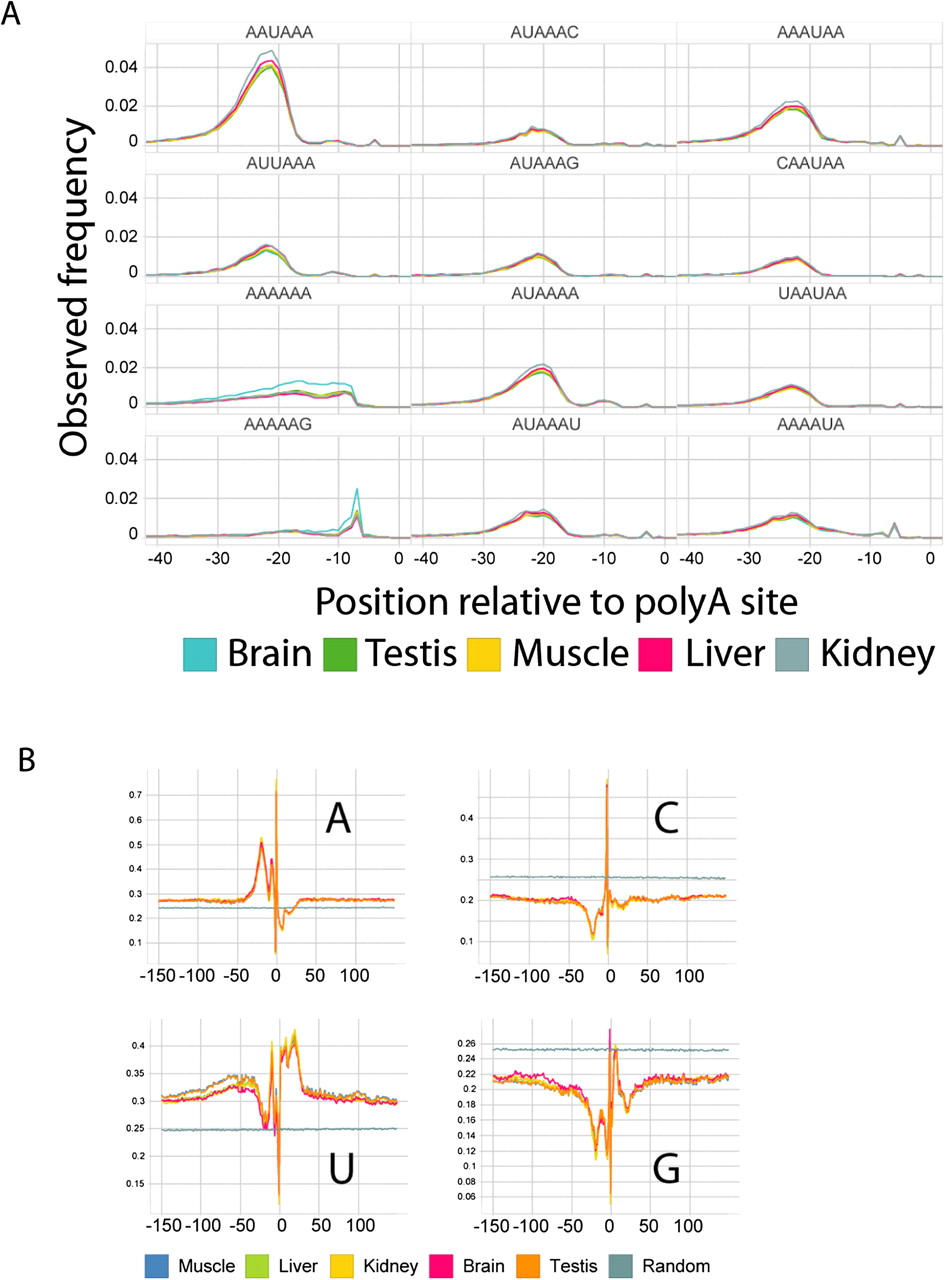
Figure 4.
Presence of the canonical polyadenylation sequence signal at filtered polyA sites. (A) The distribution of polyadenylation motif locations relative to polyA sites is enriched at a position 20–22 bp upstream of the polyA site, with a secondary peak at 10–11 bp. Positional frequencies of the 12 top-scoring hexamers (Table 2) are shown. The majority of sequences (98%) have either a perfect match or a site with a single mismatch to the canonical sequence. (B) Mean base content surrounding polyA sites computed at each base.


