
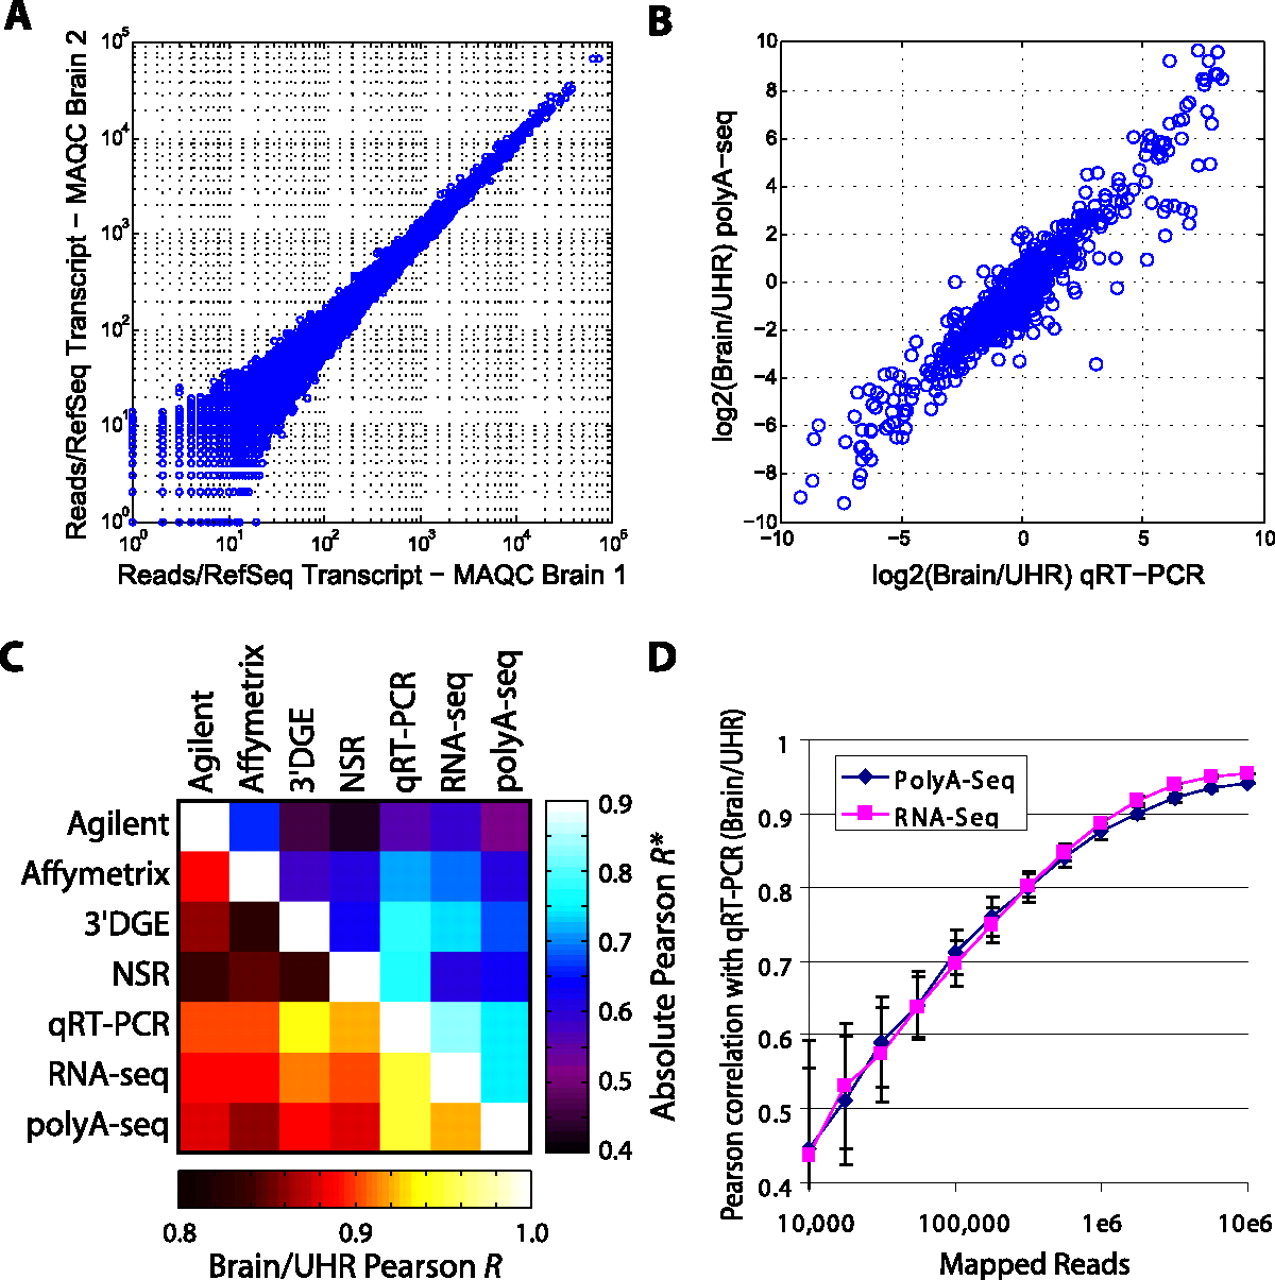
PolyA-seq DGE. (A) DGE correlation of MAQC Human Brain technical replicates independently processed from total RNA (Pearson r = 0.994). (B) DGE correlation of PolyA-seq with MAQC qRT–PCR for Brain/UHR ratio (r = 0.948). (C) Correlation values among commonly used expression technologies applied to MAQC (Shi et al. 2006) samples. Bottom, left of diagonal are correlations based on Brain/UHR ratios; top, right are correlations based on the absolute expression values (average r of brain vs. brain and UHR vs. UHR). All comparison data are published: qRT–PCR (Shi et al. 2006), Agilent (Shi et al. 2006) and Affymetrix (Shi et al. 2006) microarray data, RNA-seq (Bullard et al. 2010), 3′DGE (Asmann et al. 2009), NSR (Armour et al. 2009). (D) Pearson correlations of Brain/UHR qRT–PCR improve with increasing numbers of mapped reads for PolyA-seq and RNA-seq. Values represent the average from 100 random sampling iterations and error bars indicate standard deviation. See Methods for further details on processing of expression data.


