
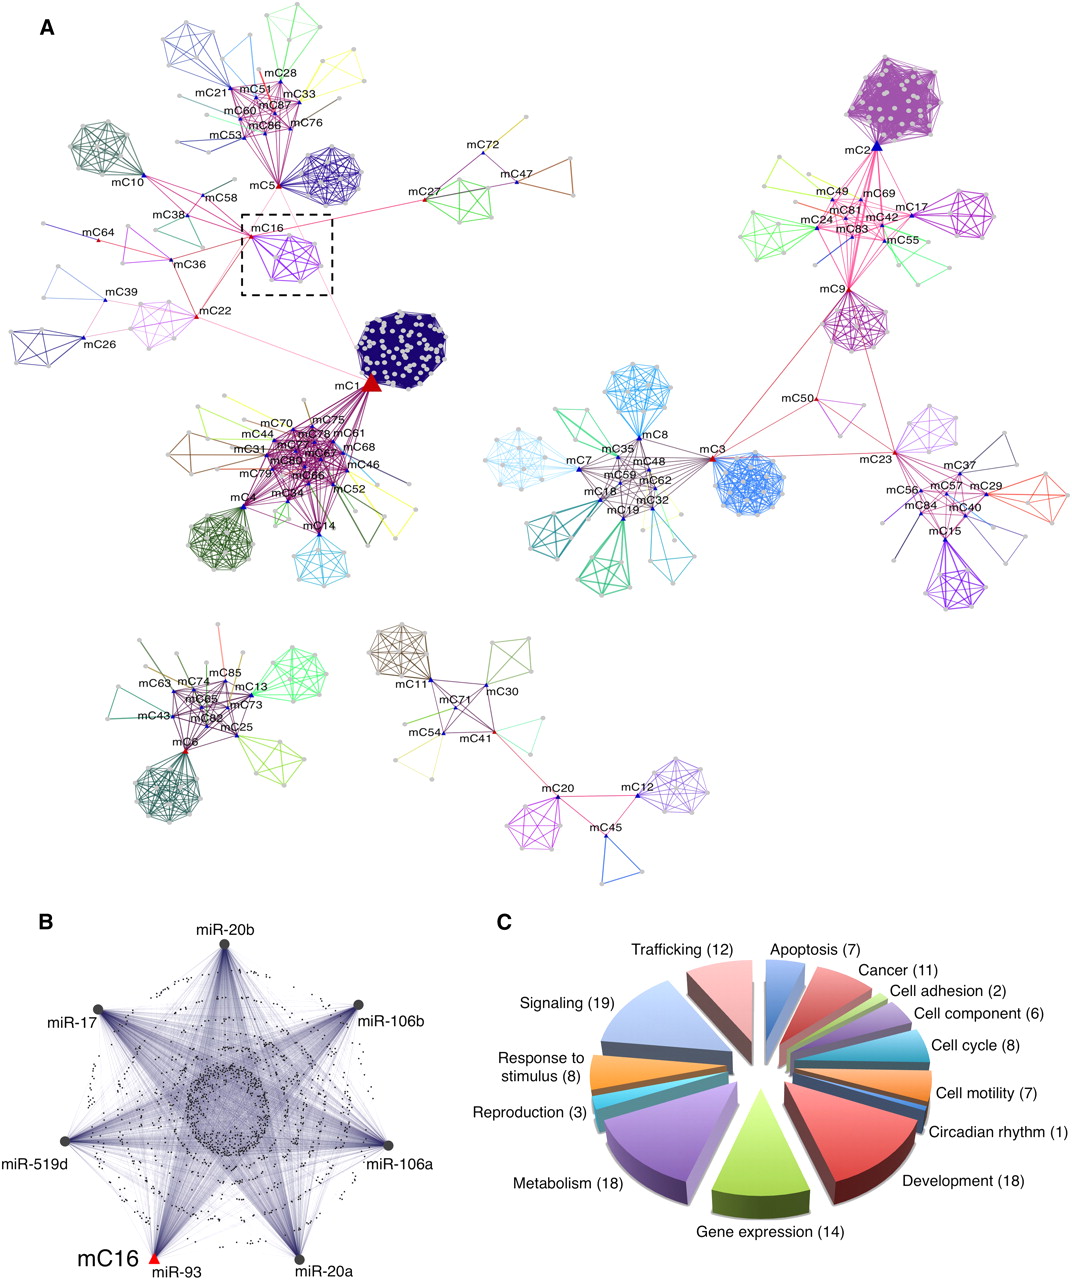
miRNA community networks. (A) Graphical representation of the community organization of human miRNA downstream transcriptional networks. (Gray circles) miRNAs. miRNAs that belong to the same community are linked with edges of the same color. For each community an exemplar (center of the miRNA community) was chosen and is indicated with a blue triangle. (Red triangle) miRNAs that link together different communities. (B) Enlarged section from A, showing the composition of miRCo16 and the mutual relationships of its miRNAs and shared target genes. (C) Frequency distribution of functions assigned to miRCOs as grouped in macrocategories. The number of miRCOs associated with each macrocategory is shown in parenthesis.


