
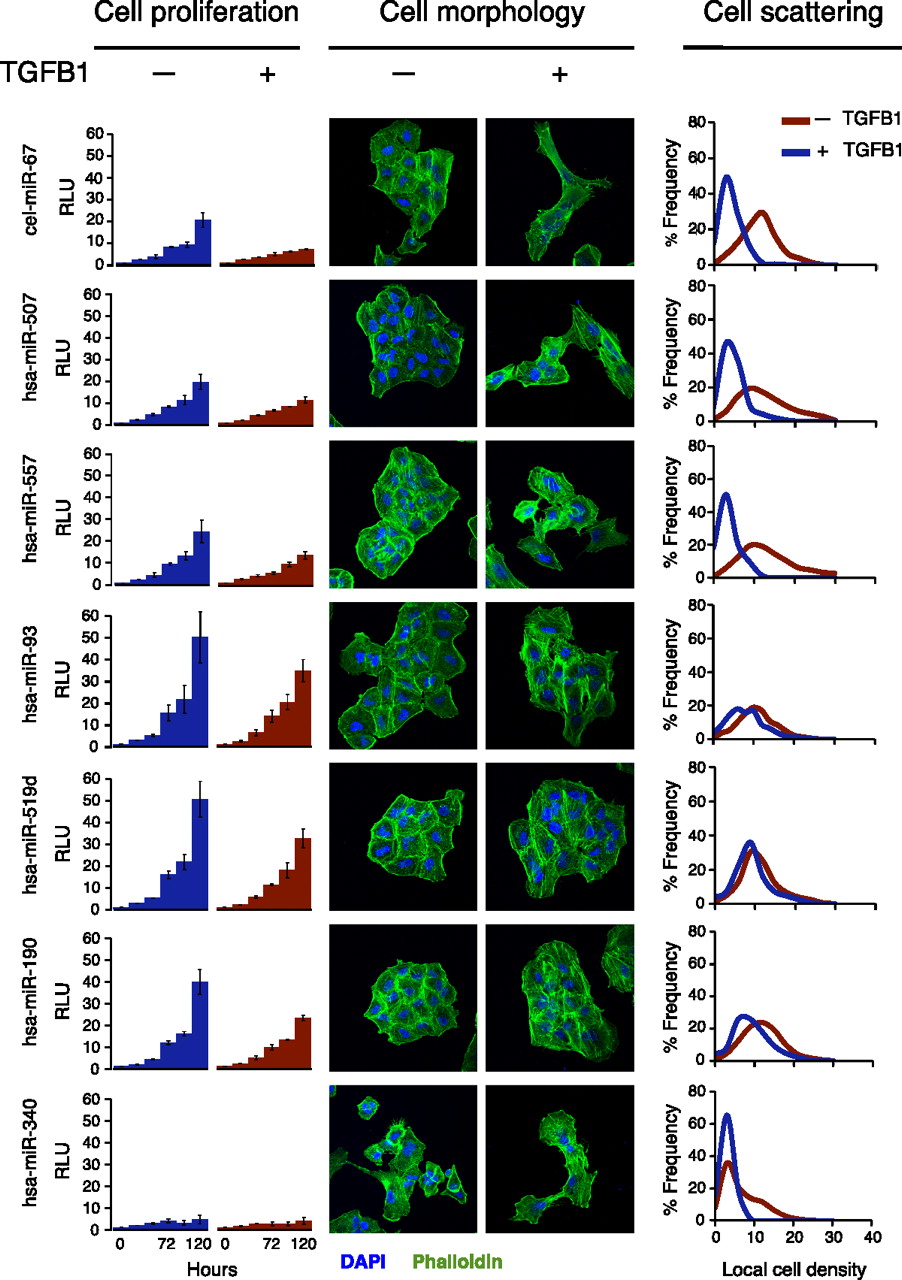
Figure 5.
miR-519d, miR-190, and miR-340 modulate TGFβ signaling. Analysis of cell proliferation, cell morphology, and cell scattering following miRNA transfection in A549 cells, with or without TGFB1 addition. All data and confocal microscope images are representative of at least three experiments for each miRNA. Cell proliferation is expressed in relative luminescence units (RLU), determined by luminescence-based cell viability assays. Confocal microscopy was performed after staining with FITC-phalloidin (green) and DAPI (blue). Cell scattering was quantified by digital image analysis of local cell density.


