
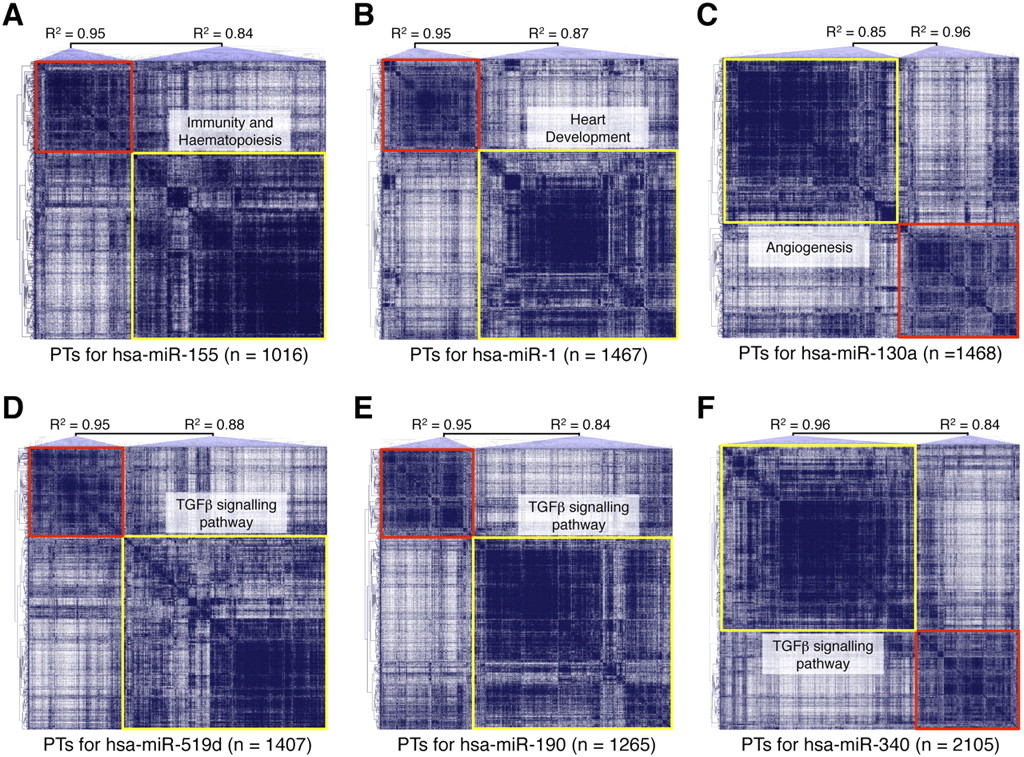
Figure 3.
Overview of COOL clusters with known and predicted functions. Analyses of miR-155 (A), miR-1 (B), miR-130a (C), miR-519d (D), miR-190 (E), and miR-340 (F). The graphs represent the COOL heat-maps of putative targets generated according to their reciprocal expression relationships. (Red and yellow boxes) Clusters with an R2 value higher or lower than the set threshold, respectively. (PTs) Predicted targets. Some of the functional categories enriched in the significant miRNA clusters are indicated.


