
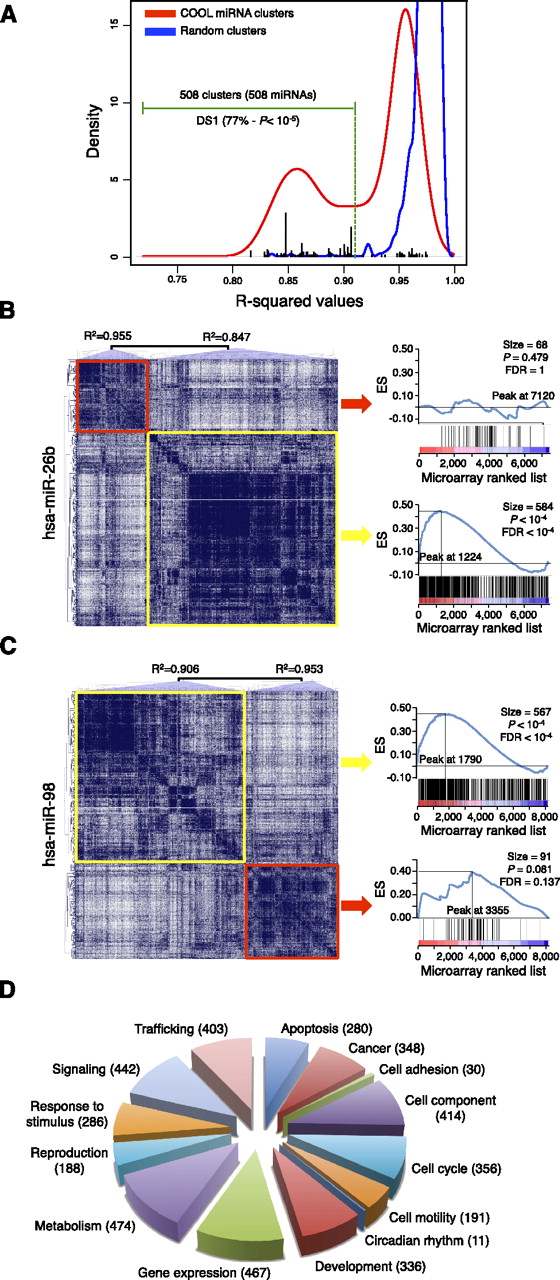
COOL analysis of miRNA-predicted target transcriptional networks. (A) Kernel density estimation of R2 values for the normal probability plot analysis of miRNA clusters (red line) and size-matched random clusters (blue line). An R2 value of 0.912 represents the lowest value for the random clusters, and this was used as the threshold (green dotted line) to select the significant miRNA clusters. (Black bars) R2 values of DS1-associated clusters. (B,C) COOL heat-maps (left) and their enrichment plots generated by gene-set enrichment analysis (right) for the data set of probes differentially expressed after miR-26b transfection (B) and miR-98 transfection (C). (Blue lines in the plots) Enrichment scores; (vertical black bars below the plots) positions of the probes from the analyzed COOL clusters according to the ranking of their expression levels, i.e., from the most down-regulated (left) to the most up-regulated. (ES) enrichment score; (FDR) false discovery rate. (D) Frequency distribution of functions assigned to COOL clusters as grouped in macrocategories. The number of miRNAs associated with each macrocategory is shown in parenthesis.


