
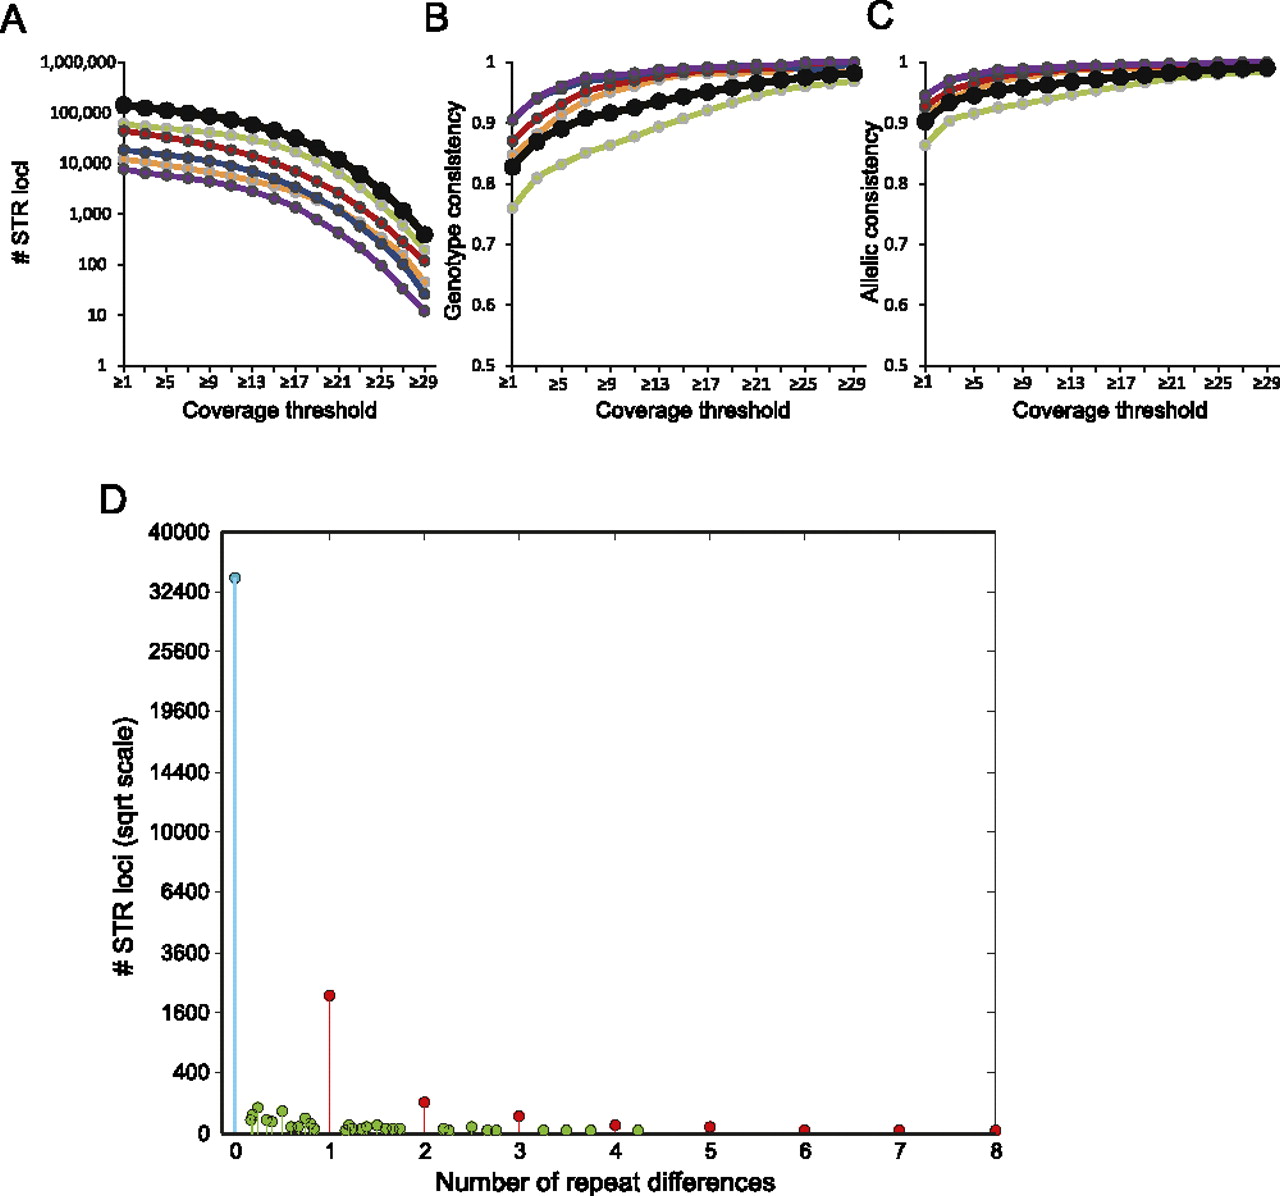
(A–C) Measuring lobSTR consistency from two samples of the same individual; (green) period 2; (orange) period 3; (red) period 4; (blue) period 5; (purple) period 6; (black) all. (A) Loci covered in both samples at increasing coverage thresholds. (B) The genotype discordance rate as a function of coverage threshold. (C) The allelic discordance rate as a function of coverage threshold. (D) Number of repeat differences at heterozygous loci. (Blue) No difference; (red) integer numbers of repeat differences; (green) noninteger numbers of repeat differences. Most discordance calls consist of a single repeat unit difference between calls in the two samples. Distance was measured as the second minimum distance between alleles of the two samples. The y-axis is given in a square root scale.


