
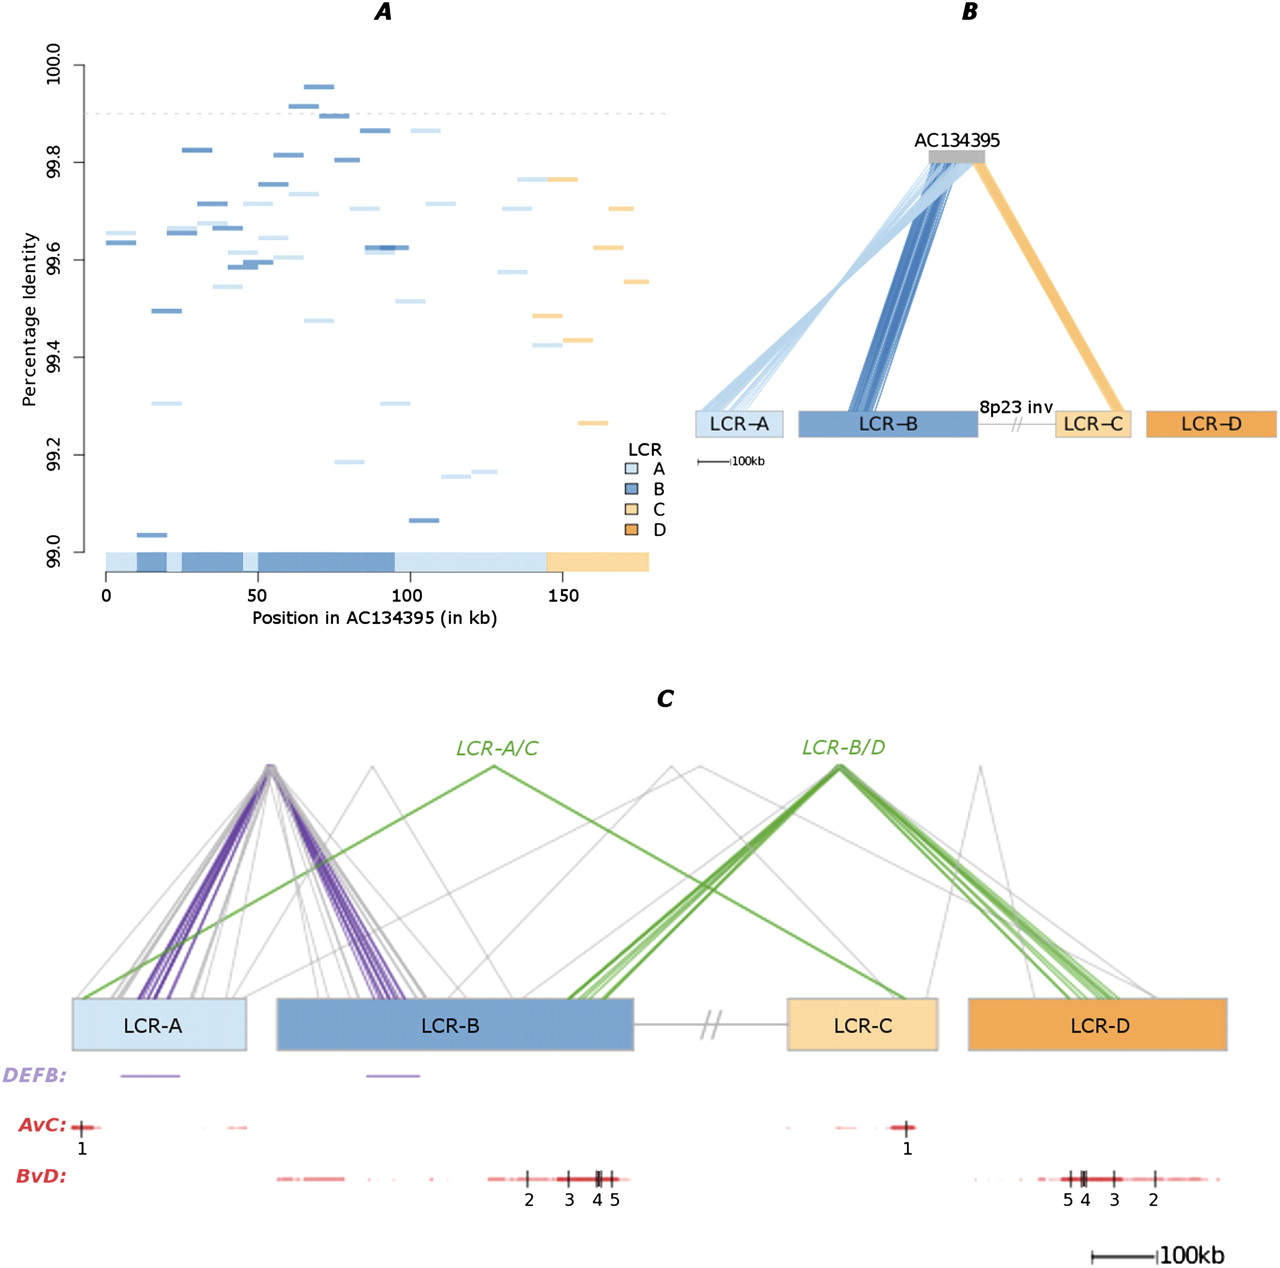
LCR structural diversity captured by sequenced RPCI-11 clones. (A) Pairwise alignments (PID > 99%) between LCRs A–D and 10-kb windows of a specified BAC. Each alignment is colored by LCR haplotype, and the dashed line represents PID > 99.9%. A “consensus” is represented on the x-axis, in which each 10-kb window is assigned to its most homologous LCR haplotype. In this example, an interleaved mosaic pattern between LCR-A and -B is found in the first 100 kb of the clone, followed by a transition into LCR-C toward the clone's end. (B) For the specified BAC, the top pairwise alignment for each 10-kb BAC window (i.e., the consensus) is mapped to its corresponding LCR haplotype (joining lines). The inversion's single-copy region (interrupted gray line) links the LCR-B and -C haplotypes. This example includes a junction between LCR-A and -C. (C) LCR haplotype junctions discovered in six finished RPCI-11 BACs. Each transition from one haplotype to another is represented by a joining line. (Purple/green) Those that cluster together and are observed in more than one BAC. The first group (purple, represented by AC134683, AC134395, and AC148106) covers the DEFB locus. The second group (green, represented by AC134683 and AC134395) constitutes a junction between LCR-A and LCR-C. The third group (green, involving AC087342, AC092766, AC105214, and AC148106) represents junctions between LCR-B and LCR-D. Notably, AC087342 is anchored by 46 kb of uniquely mapping sequence in the distal end of the inversion. The first annotation track represents the copy-number variant DEFB locus (purple); the second and third annotation tracks (red) indicate inverted repeats between LCR-A and -C (“AvC”) or LCR-B and -D (“BvD”). Statistically significant recombinant sites (numbered 1–5) (Table 1) are marked by vertical breaks in the inverted repeats. The inversion's single-copy region is represented as in (B).


