
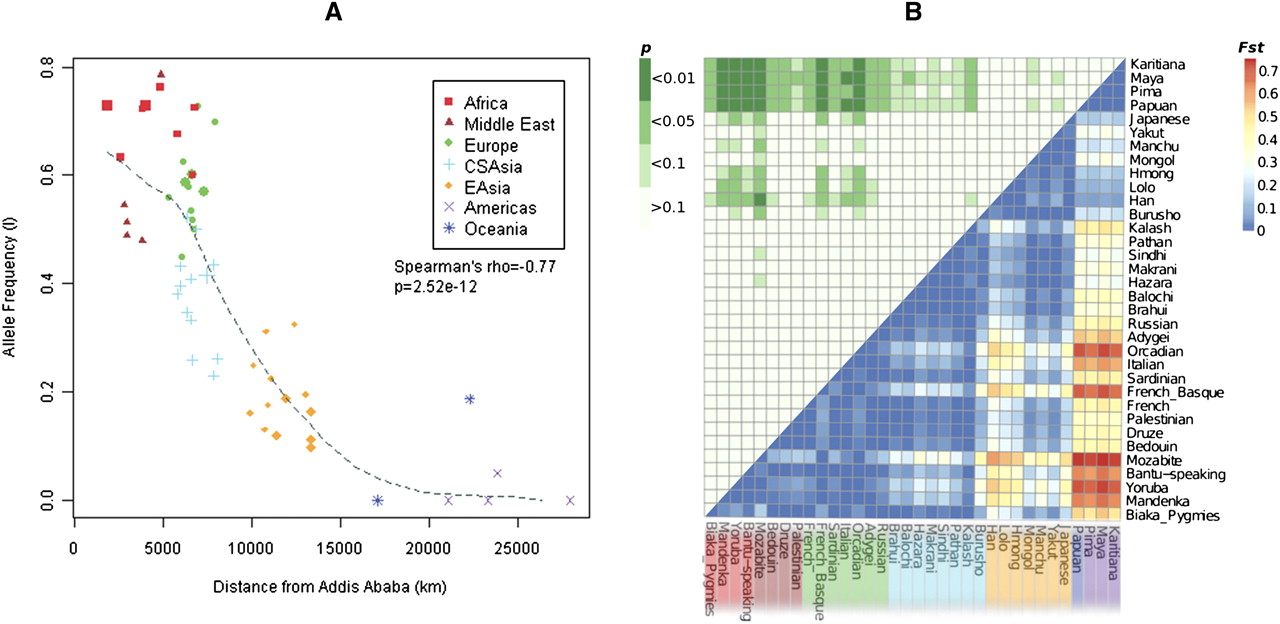
Population stratification of 8p23-inv. (A) The worldwide frequency distribution of 8p23-inv. The frequency of the inverted allele (I) in each population (Supplemental Table S4) is plotted against geographical distance from Addis Ababa (Ethiopia). Populations are color-coded according to continental origin, and larger symbols correspond to larger samples (n > 60). The dashed LOESS fitted line highlights the significant negative correlation between the two variables, as assessed by the Spearman's rank correlation test. Although one Oceanic sample (Tongan/Samoan) appears as an outlier, its allele frequency (19%) is consistent with this sample's previously reported genetic relationship to East Asians (Xing et al. 2010). (B) Pairwise Fst between HGDP populations, based on 8p23-inv. The bottom right triangle shows pairwise Fst values: Each shaded box represents a pairwise population comparison, with higher values in red. The top left triangle (green) shows the corresponding significance of the Fst values relative to an empirical distribution of 1000 SNPs (Supplemental Fig. S6C). (Dark green) Fst values in the top 1% of the distribution (i.e., P < 0.01); (lighter green) Fst values in the top 5% (i.e., P < 0.05). Populations are grouped by continent of origin (as in A).


