
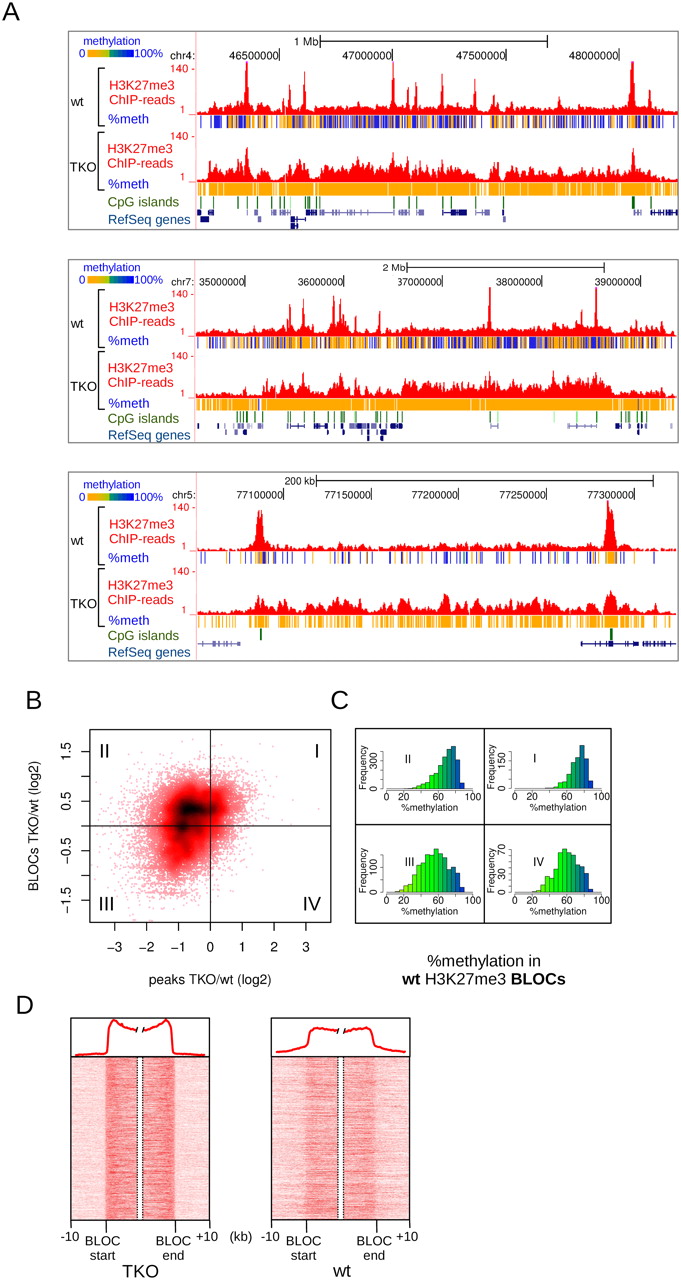
Changes in H3K27me3 patterns upon loss of DNA methylation in Dnmt triple-knockout (TKO) mES cells. (A) Examples of H3K27me3 BLOCs appearing in TKO cells, and concomitant loss of H3K27me3 in localized peaks. Per covered CpG, percentage methylation as derived from H3K27me3-ChIP-BS-seq is indicated in color. (B) Scatterplot of H3K27me3 changes in peaks (x-axis) vs. BLOCs (y-axis). H3K27me3 peaks were matched against BLOCs in which they reside. I–IV indicate the four quadrants of the plot, as determined by log2 fold changes deviating from zero. (C) Histograms of percent DNA methylation in the BLOCs of each quadrant of B, as deduced from H3K27me3-ChIP-BS-seq in wild-type mES cells. (D) Density maps of H3K27me3 through BLOC transition regions detected in TKO mES cells. Average profiles are shown on top.


