
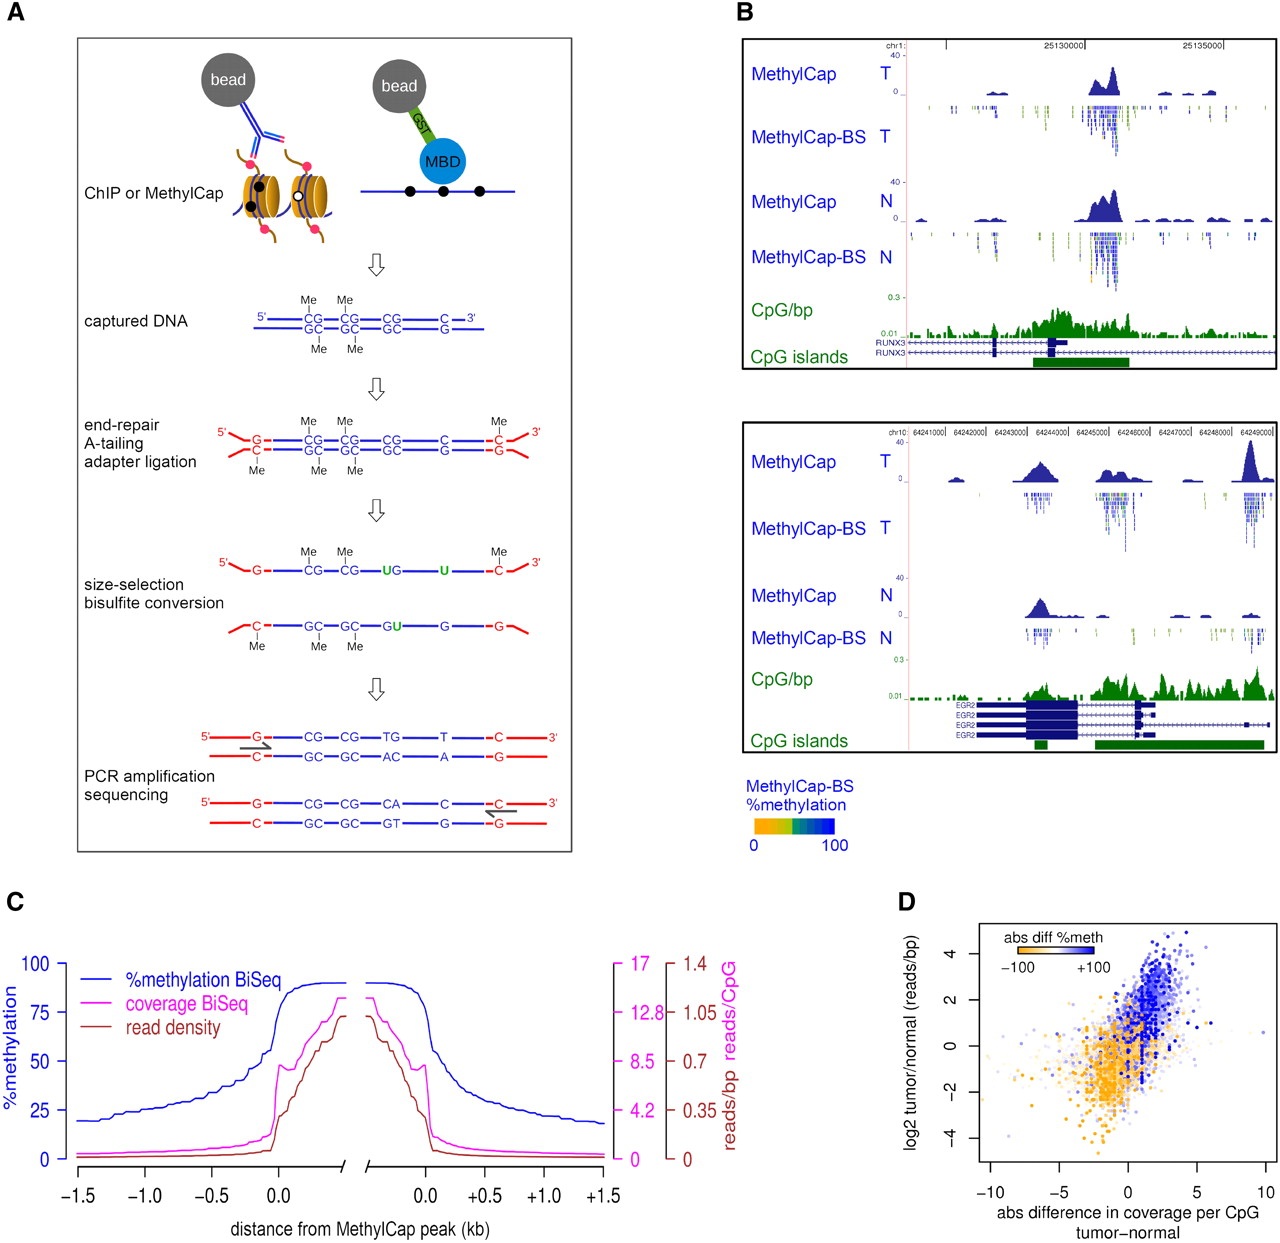
Integration of capturing methods and bisulfite-deep sequencing: ChIP-BS-seq and MethylCap-BS-seq. (A) Schematic outline of the ChIP-BS-seq and MethylCap-BS-seq procedures. Capturing of genomic regions of interest is achieved by the MethylCap procedure or ChIP with an antibody of interest. Captured DNA is processed as indicated. Shown intermediate products and final PCR fragments indicate the fate of unmethylated as well as methylated cytosines throughout the procedure. (B) Examples of conventional MethylCap-seq and MethylCap-BS-seq data of normal (N) and tumor (T) colon tissues. For each covered CpG, percentage methylation as derived from the MethylCap-BS-seq data is indicated by color (yellow, 0%; blue, 100%). (Green) CpG islands and a CpG density profile (CpG/bp). (C) Average profiles of DNA methylation and coverage in MethylCap peaks of normal colon tissue, as determined by MethylCap-BS-seq. (Blue) Percentage DNA methylation; (magenta) CpG coverage; (brown) read density. (D) MethylCap-BS-seq analysis of differentially methylated regions from normal/tumor colon tissue. Regions that gain DNA methylation in tumor tissue show increased CpG coverage (x-axis) and read-density (y-axis). Color-code depicts absolute changes in percent methylation of these regions, as determined by bisulfite sequencing. (Blue) increase; (yellow) decrease.


