
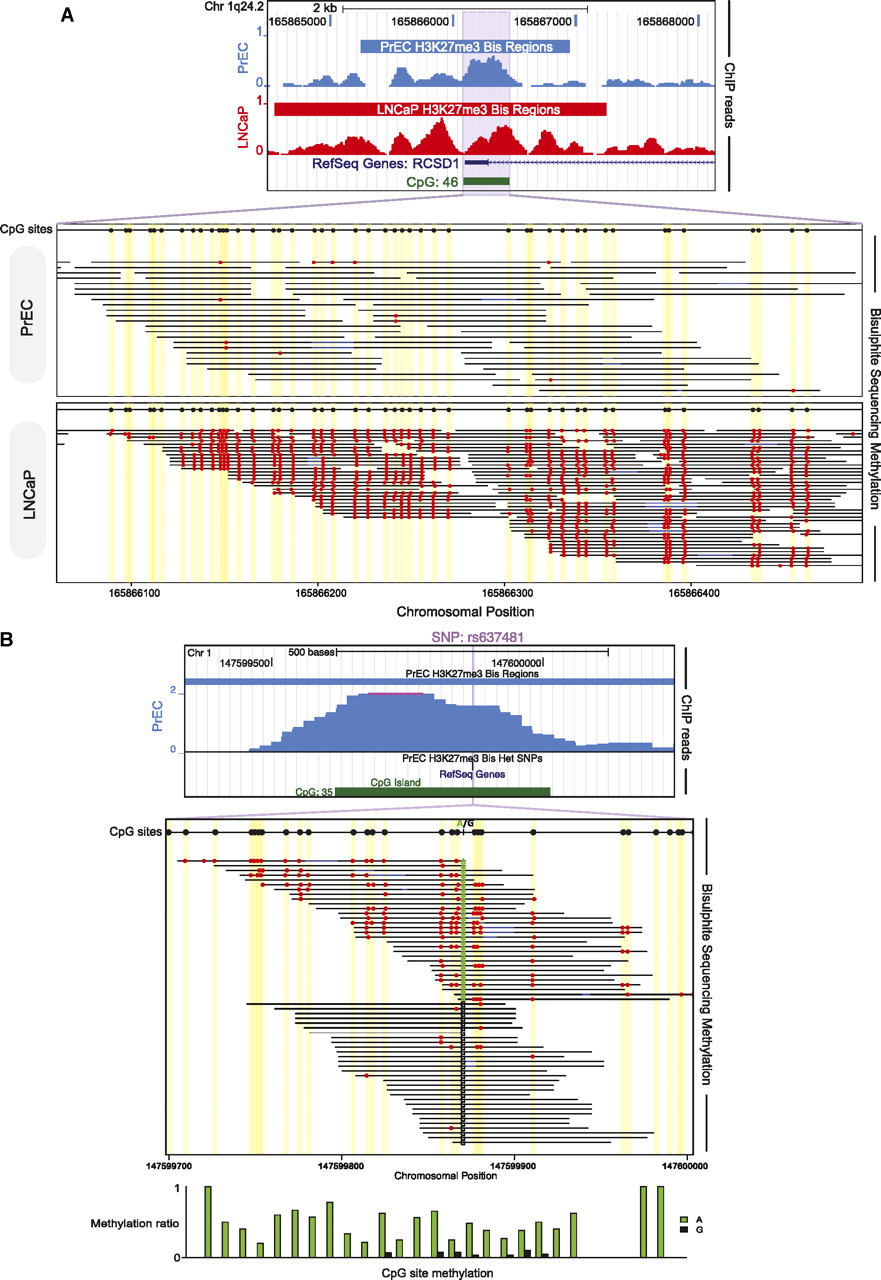
BisChIP-seq examples showing differential methylation and allele-specific methylation in H3K27me3-enriched ChIP DNA. (A) UCSC Genome Browser screen shot of BisChIP-seq data showing the RCSD1 TSS and CpG island, where H3K27me3-modified histones are enriched in both PrEC and LNCaP. (Purple shading) In PrEC cells the CpG island is unmethylated, whereas in LNCaP cells the island becomes extensively DNA methylated without losing the H3K27me3 mark. Individual bisulfite methylation sequencing reads are shown with CpG sites (black circles) in yellow shading for each molecule. (Red circles) CpG DNA methylation. (B) Example of allele-specific methylation in PrEC cells at rs637481 on chromosome 1. UCSC Genome Browser screen shot of BisChIP-seq data indicates regions of significant H3K27me3-enrichment called by ChromaBlocks. (Purple line) Position of the A/G SNP at rs637481. Individual bisulfite molecule sequencing reads are shown with all CpG sites in the sequence (black circles) in yellow shading for each molecule. (Red circles) BisChIP-seq readout of CpG DNA methylation. The allele-specific methylation ratio is indicated by bar graphs.


