
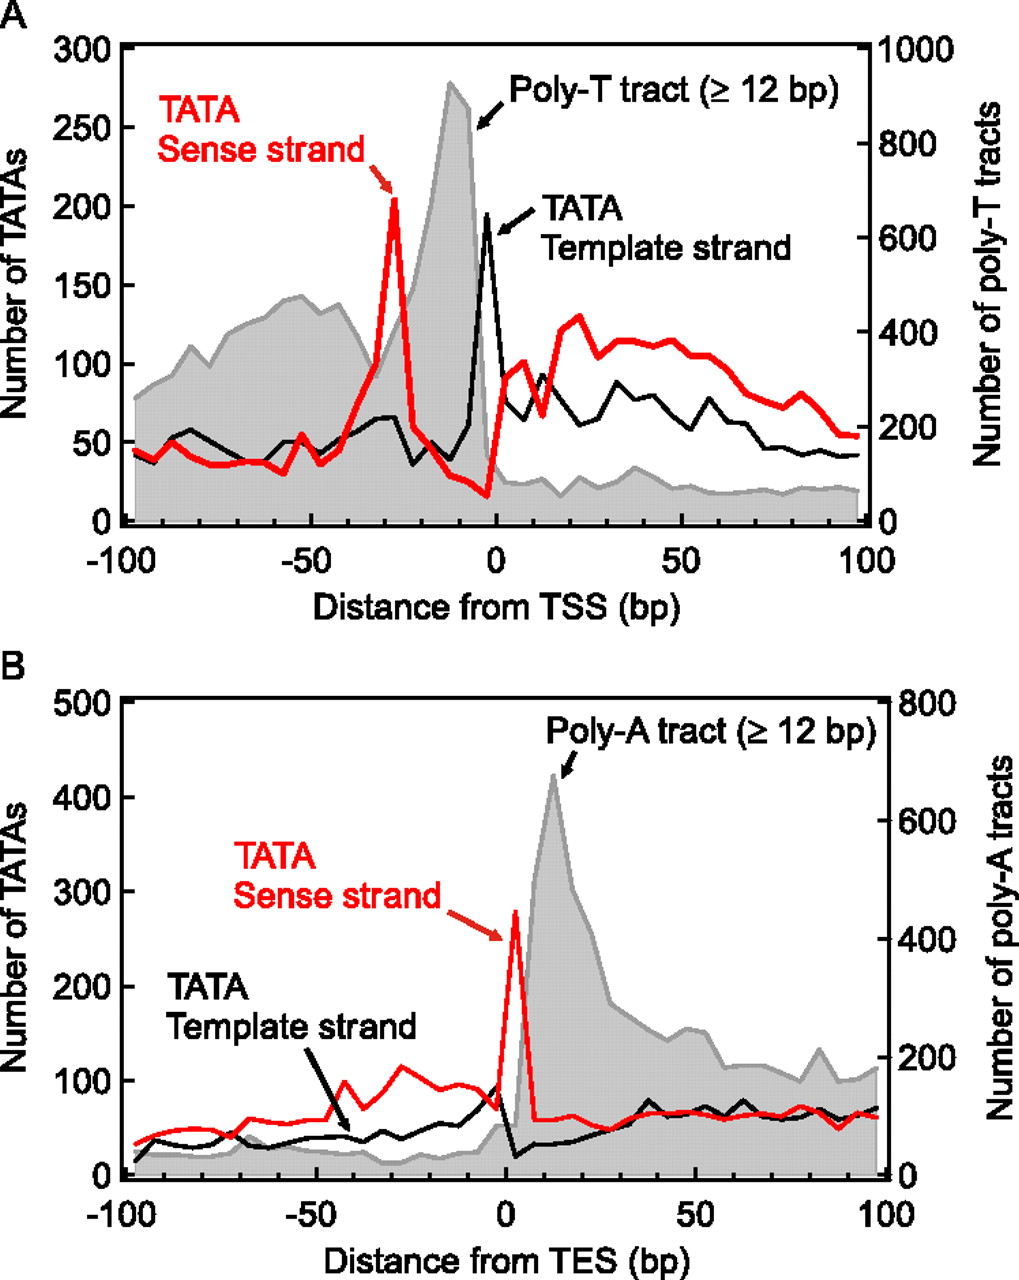
Figure 2.
Frequency distribution of TATA elements as TATAAA(A/T)(A/T) midpoint locations around the 5′ and 3′ ends of Dictyostelium genes. TATA elements were counted on the sense (black trace) and template (red trace) strand. Their frequency was binned at the 5-bp interval and plotted as a function of the distance from the TSS (A) and TES (B). The frequency distribution of poly-T/poly-A tract locations (≥12 bp) was produced in the same way and is shown in gray.


