
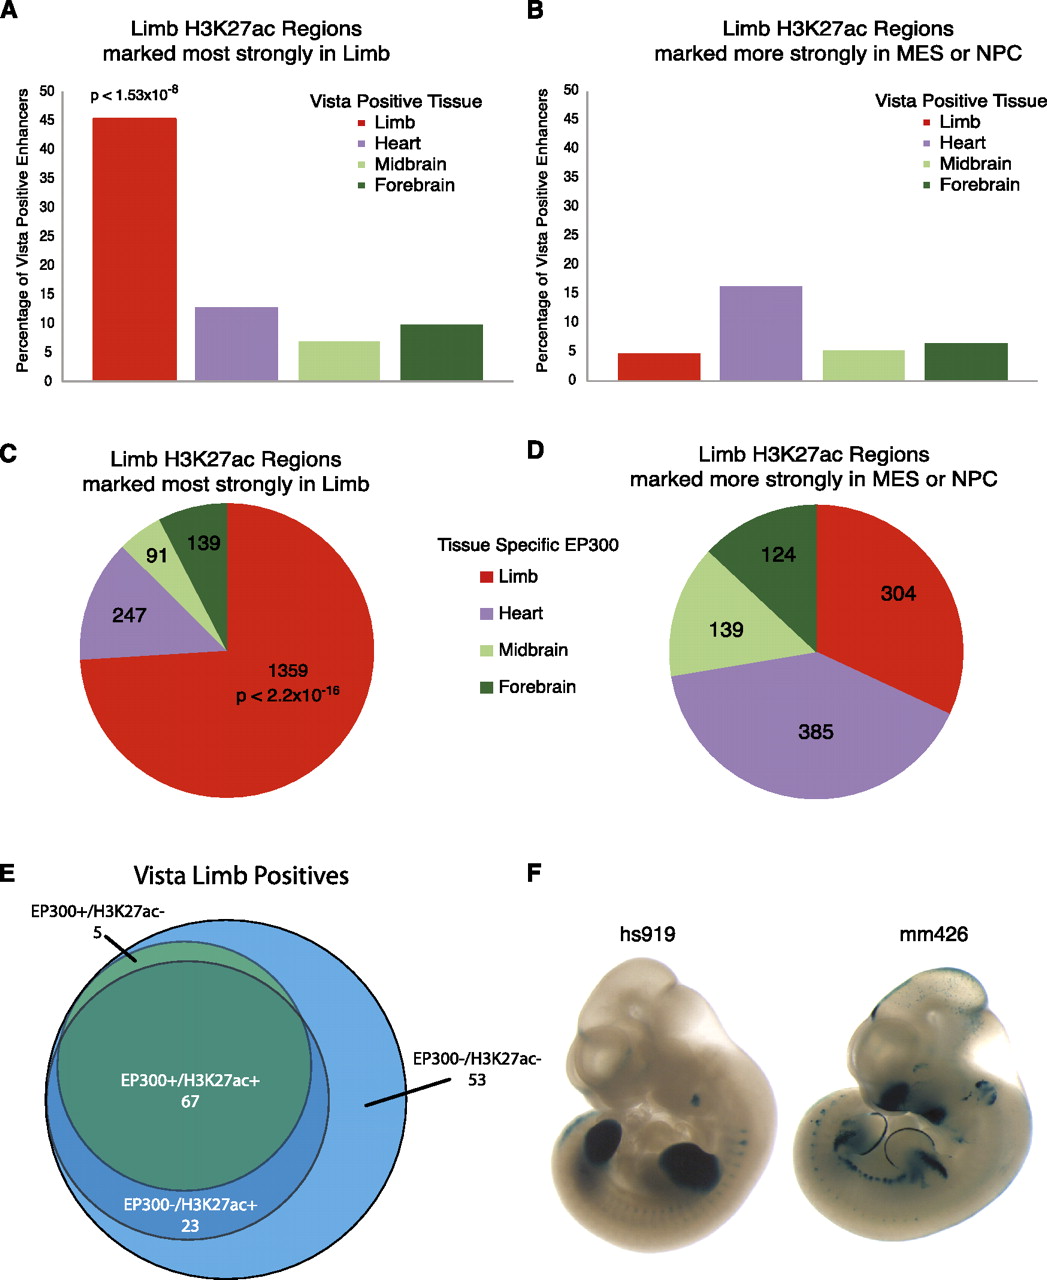
H3K27ac identifies tissue specific enhancers. (A) Percentage of known enhancers from the Vista Enhancer Browser that overlap E11.5 H3K27ac regions strongly marked in limb compared with MES or NPC (from Supplemental Fig. S8). (Bars) Percentage of total positive enhancers active in the indicated tissue that are marked by H3K27ac in limb. Limb enhancers are significantly enriched versus enhancers active in other tissues (Fisher exact test). (B) Overlap of H3K27ac regions in limb that are more strongly marked in either MES or NPC and Vista enhancers. (C) Overlap of E11.5 H3K27ac regions strongly marked in limb compared with MES and NPC with tissue-specific EP300 sites. Limb EP300 sites are significantly over-represented (Fisher exact test). (D) Overlap of H3K27ac regions that are more strongly marked in either MES or NPC and tissue-specific EP300 sites. (E) Venn diagram of Vista limb enhancers marked by limb EP300, limb H3K27ac, both, or neither. (F) Representative Vista limb enhancers identified by E11.5 H3K27ac alone.


