
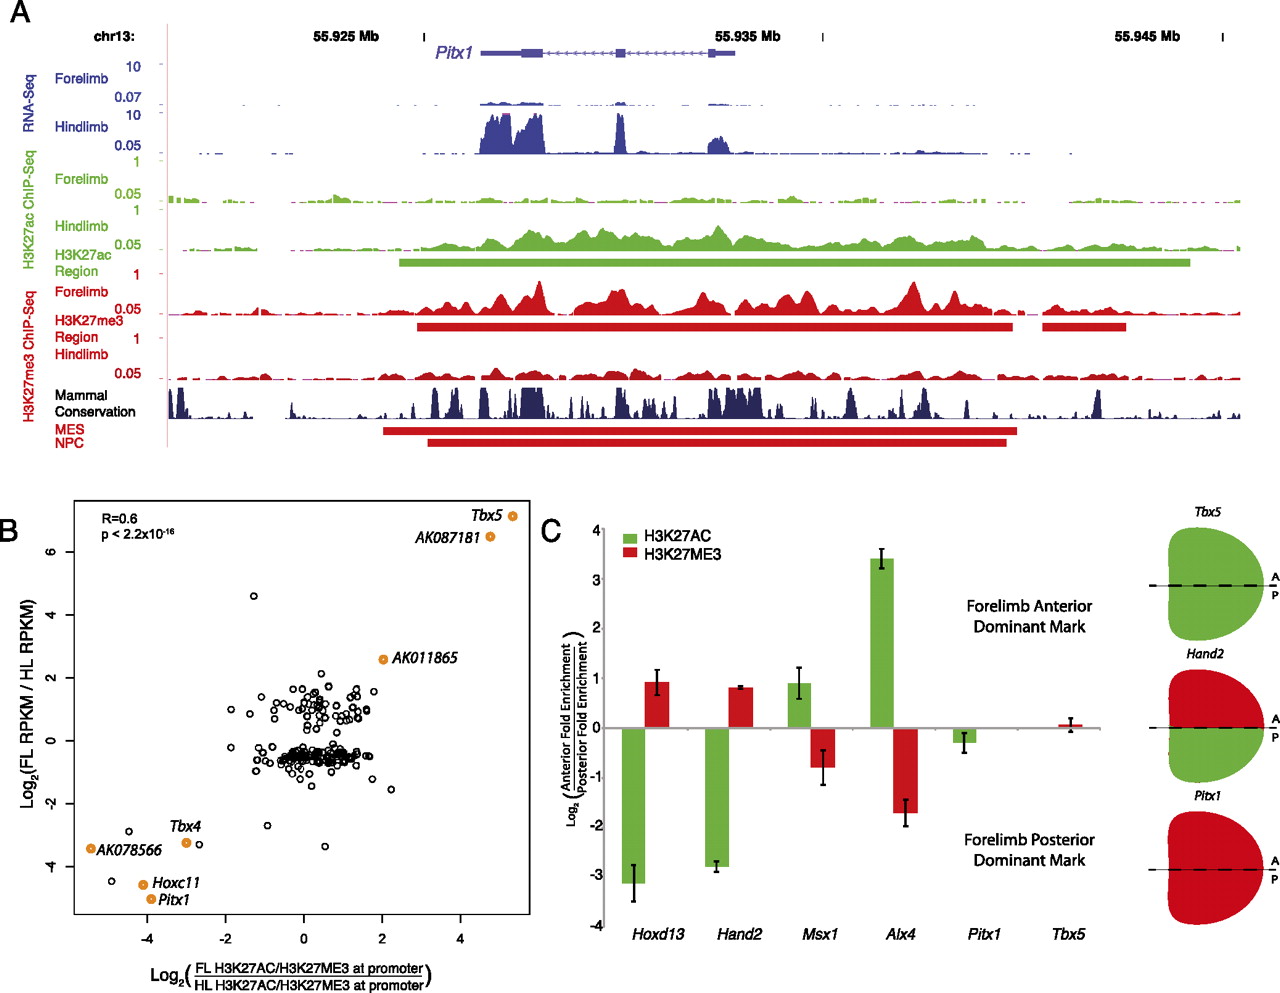
Relative H3K27ac and H3K27me3 enrichments at promoters correlate with gene expression in E10.5 limb buds. (A) Gene expression (blue), H3K27ac signal (green), and H3K27me3 signal (red) at the hindlimb-specific gene Pitx1. All signal plots represent reads per million mapped total reads. Green and red bars below signal plots, respectively, illustrate H3K27ac or H3K27me3-enriched regions in limb. H3K27me3-enriched regions in MES and NPC cell lines are shown at bottom. The figure was generated using the UCSC Genome Browser. (B) Scatterplot of the ratio of log2(RPKM) values for genes differentially expressed between forelimb and hindlimb versus the log2(ratio of H3K27ac vs. H3K27me3 signals at their promoters). Selected known and novel limb genes that show strong correlations between these values are indicated in orange. The P-value shown was calculated using a linear regression t-test. (C) Bar chart depicting relative levels of H3K27ac and H3K27me3 enrichment at indicated gene promoters in the anterior and posterior halves of E10.5 forelimb buds. (Right) The dominant mark present for representative genes that are ubiquitously expressed (Tbx5), completely repressed (Pitx1), or regionally restricted (Hand2).


