
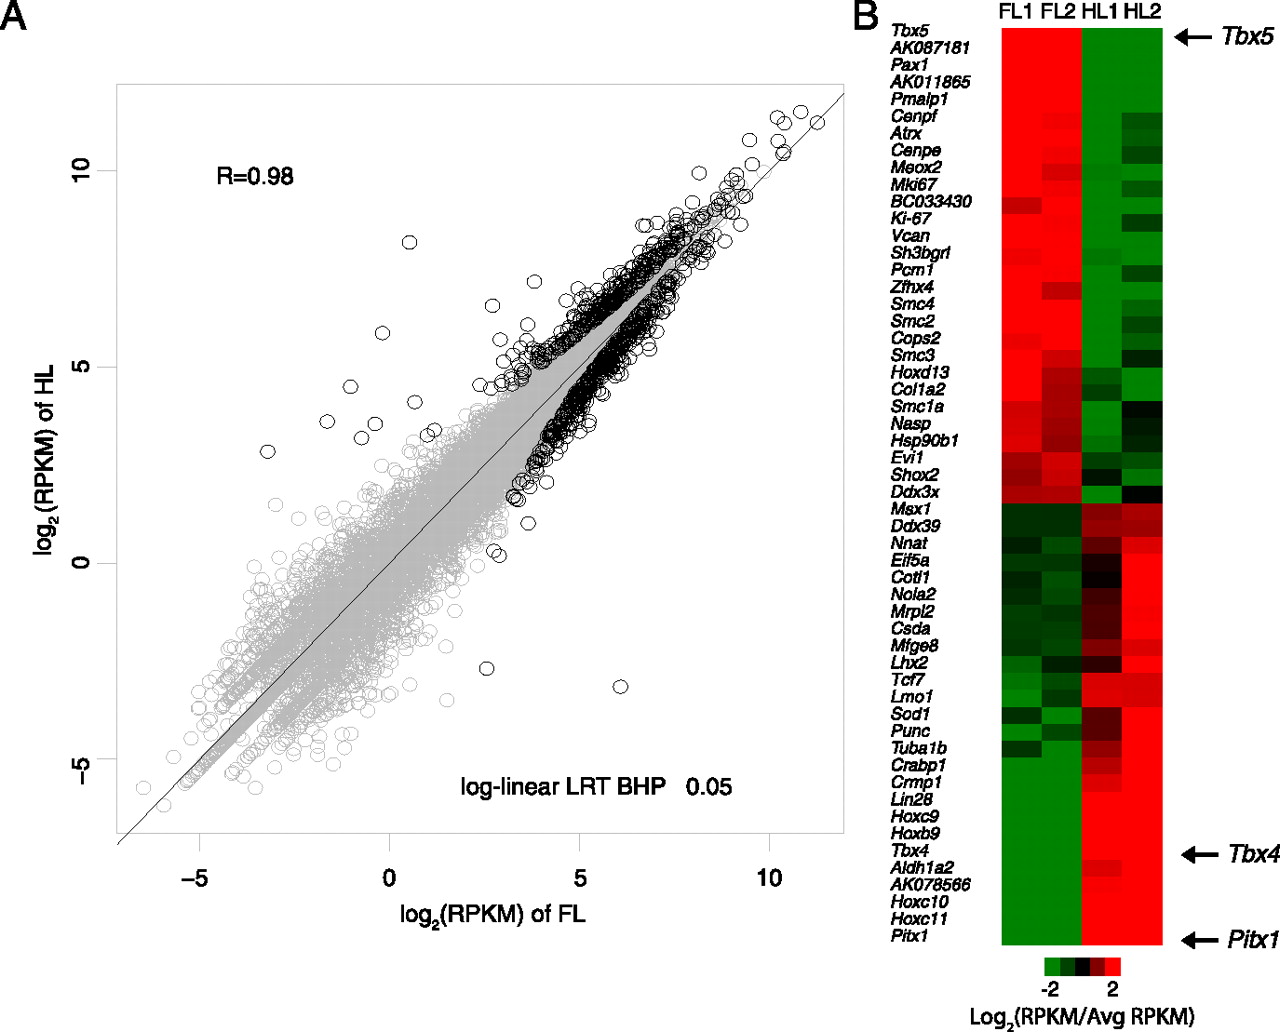
Figure 1.
Whole-transcriptome analysis of mouse E10.5 limb. (A) Log2 (RPKM) values for 27,189 genes compared between a single biological replicate of forelimb and hindlimb. Genes identified as differentially expressed by log-linear LRT (BHP <0.05) are shown as black circles. (B) Heatmap of selected genes significantly differentially expressed between forelimb and hindlimb. For each gene listed, RPKMs were averaged across all replicates and values for individual replicates are plotted as a log2 fold change relative to this average value.


