
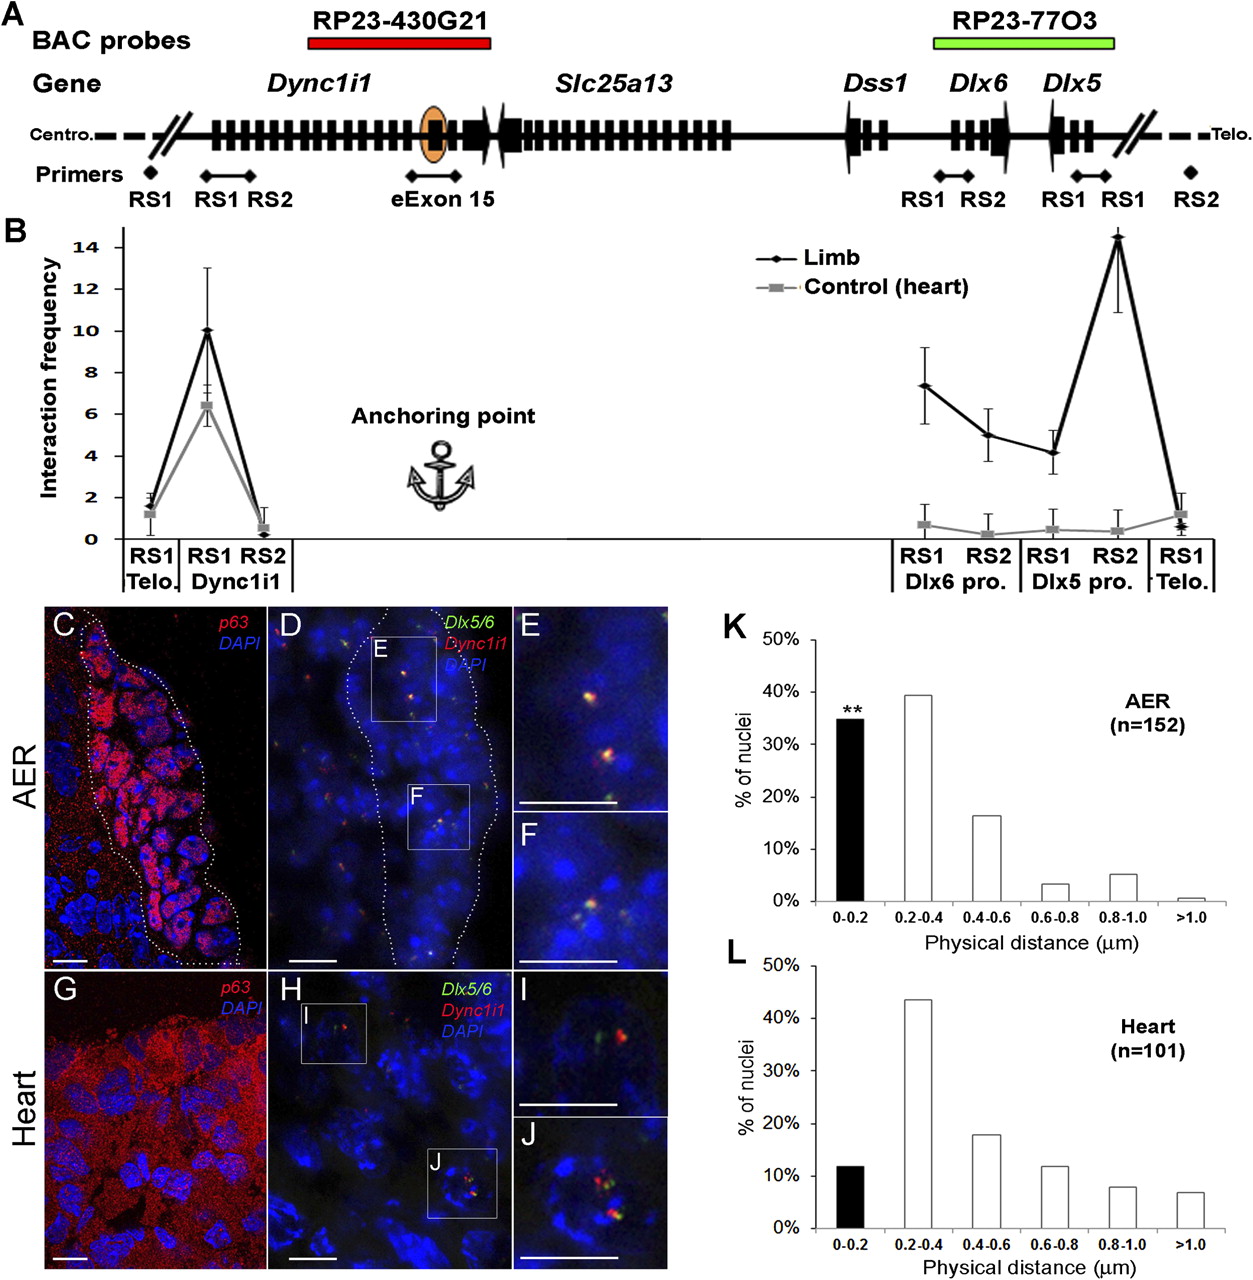
3C and DNA-FISH show a physical interaction between Dync1i1 eExon 15 and Dlx5/6 promoter regions in the mouse E11.5 limb. (A) Schematic of the Dync1i1-Dlx5/6 locus, showing the relative location of the primers used for 3C and the BAC probes used for DNA-FISH. (B) Chromatin looping events detected using 3C between Dync1i1 eExon 15 (orange oval) and promoters within the Dync1i1-Dlx5/6 locus. The closest HindIII restriction sites (RS1 and RS2) of each promoter were used to analyze the interaction frequencies to Dync1i1 eExon 15 (anchoring point). In the limb, the interaction frequencies between Dync1i1eExon 15 and Dlx6 and Dlx5 promoter regions were significantly higher compared to the heart negative control (more than 10- and 15-fold, respectively). No significant interaction differences were found between Dync1i1eExon 15 and the Dync1i1 promoter, the closest tested site to the anchoring point, or the two control regions (∼900 kb away from the Dync1i1-Dlx5/6 locus) in limb versus heart tissues. (Error bars) SE of the average of three independent PCR reactions. (C–L) DNA-FISH results with BAC probe RP23-430G21, which covers the Dync1i1eExon 15 region (red), and BAC probe RP23-77O3, which covers the Dlx5/6 gene regions (green). (C) E11.5 limb section with the dotted line highlighting the AER, as depicted by p63 staining in the nucleus. (D) BAC probes and DAPI staining of E11.5 limbs. (Squares) Magnified regions in E and F that highlight the colocalization of Dync1i1eExon 15 and Dlx5/6 signals. (G) E11.5 heart section shows p63 staining in the cytoplasm. (H) BAC probes and DAPI staining of E11.5 heart. (Squares) Magnified regions in I and J that show a separation of Dync1i1eExon 15 and Dlx5/6 signals. The white scale bars represent 5 μm length. (K,L) Calculated frequencies for every 0.2 μm distance interval in mouse E11.5 AER (K) and heart (L) tissues. (Black columns) Fraction of colocalized signals (0–0.2 mm). The number (n) of loci observed in this experiment indicates a significant difference between the frequencies of the colocalized signals in the AER and heart tissues (**P < 0.01; Student's t-test).


