
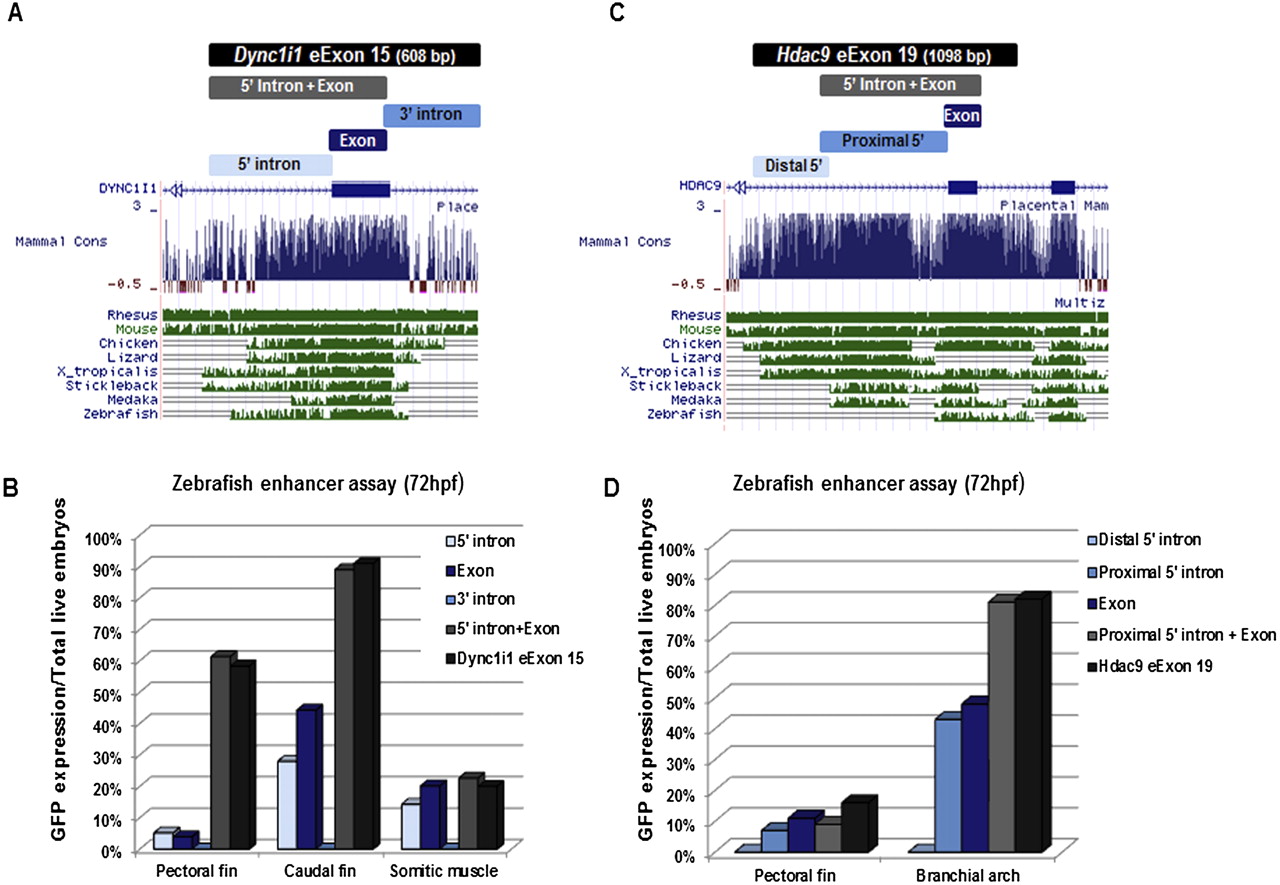
Segmental analysis of DYNC1I1 eExon 15 and HDAC9 eExon 19 enhancer function in zebrafish. (A) DYNC1I1 eExon 15 was divided into three overlapping segments: 5′ intron, exon, 3′ intron. (Below) The UCSC Genome Browser (http://genome.ucsc.edu) conservation track shows that only the 5′ intron and exon are conserved between human and fish. (B) Zebrafish enhancer assay results for the different DYNC1I1 eExon 15 segments. While the 5′ intron and exon show enhancer activity in the fins and somitic muscles, only the combination of both gives comparable enhancer expression to the 608-bp originally injected fragment of DYNC1I1 eExon 15. The 3′ intron segment did not show enhancer activity. (C) HDAC9 eExon 19 was divided into three overlapping segments: distal 5′ intron, proximal 5′ intron, and exon. (Below) The UCSC Genome Browser conservation track shows that the proximal 5′ intron and exon are conserved between human and fish. (D) Zebrafish enhancer assay results for the different HDAC9 eExon 19 segments. While the proximal 5′ intron and exon show enhancer activity in the pectoral fin and branchial arches, only the combination of both gave comparable enhancer expression to the previously injected 1098-bp HDAC9 eExon 19 sequence. The distal 5′ intron segment did not show enhancer activity. Enhancer function is plotted as percentage of GFP expression/total live embryos. Each of these segments was injected into at least 100 zebrafish embryos.


