
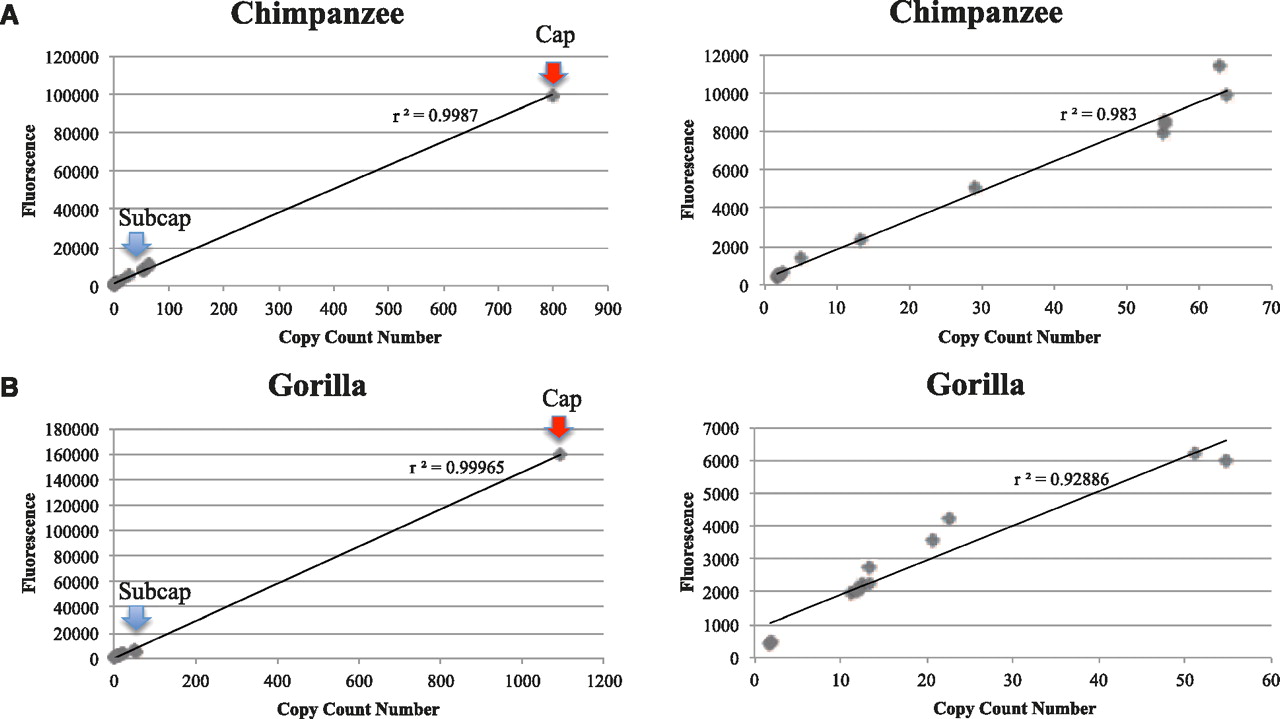
Figure 5.
Distribution copy number counts versus fluorescence. Copy number estimates of sequence read-depth for each genomic region correlate strongly (r2 = 0.99) with measured fluorescence intensity for every probe distributed on chromosome 2 and chromosome 10 (see Supplemental Table S3). Red arrows show the location of the single probe positive for cap, while blue arrows display the group of probes positive for subcap in (A) chimpanzee and (B) gorilla (left panels). The correlation rates reduce when hyperexpanded segments are excluded from the analysis (right panels).


