
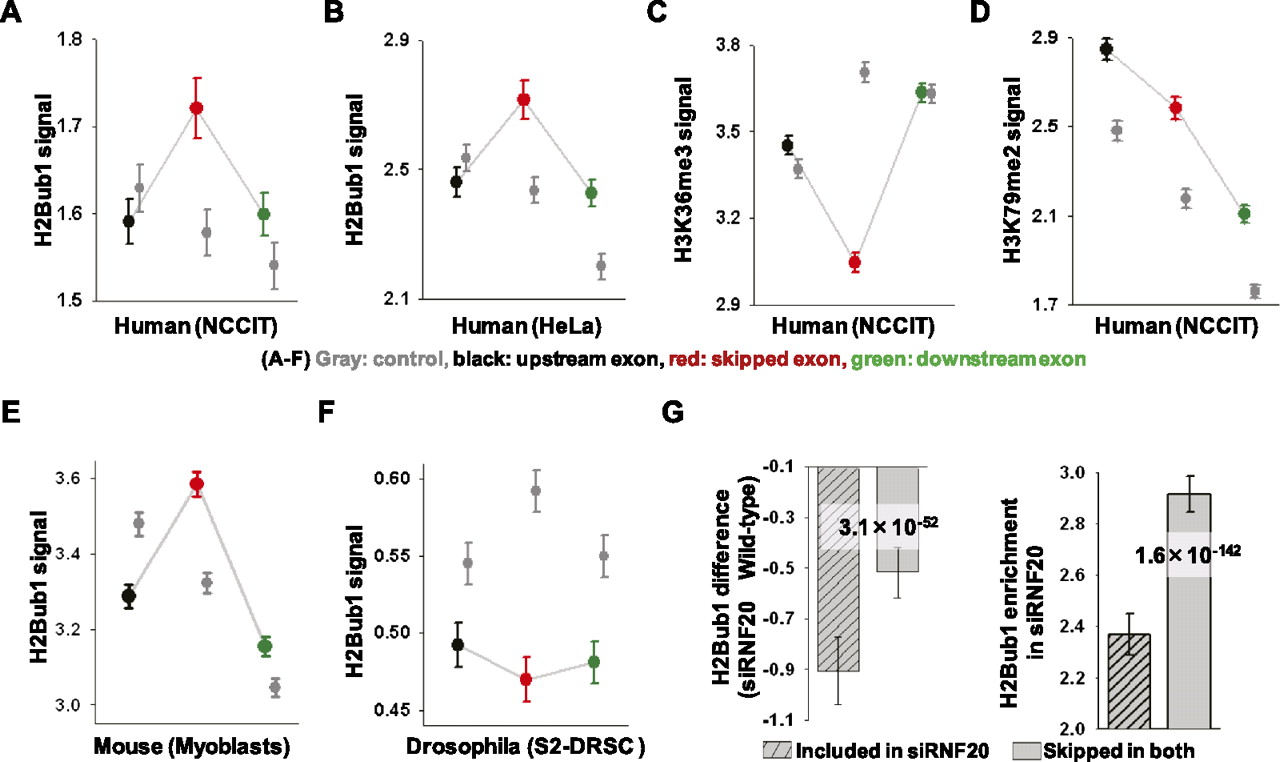
Skipped exons have a stronger H2Bub1 signal than flanking exons. (A–F) H2Bub1, H3K36me3, and H3K79me2 signals in skipped exons and their flanking exons. (Gray) Three constitutive exons used as controls. In the control, H2Bub1 shows decreased patterns from 5′ to 3′, except in Drosophila (n = 16,724 in NCCIT). (Red, black, green) Skipped exon, upstream of the skipped exon, and downstream from the skipped exon, respectively. (Y-axis) Average modification signals with standard deviation error bars. In NCCIT (n = 12,337), HeLa (n = 9722), and myoblast (n = 12,356) cells, the H2Bub1 signals were higher in skipped exons than in flanking exons. In Drosophila, however, the H2Bub1 signal was lower in skipped exons than in flanking exons (n = 3201). The H3K36me3 signal was lower in skipped exons and H3K79me2 did not show any specific pattern in the skipped exons. (G) Differences in H2Bub1 between wild-type and siRNF20-transfected NCCIT cells for persistently skipped exons and included exons with standard deviation error bars (left). H2Bub1 enrichment is shown for both persistently skipped exons and included exons in siRFN20-transfected cells with standard deviation error bars (right). H2Bub1 enrichment was determined by dividing the H2Bub1 tag density by the average tag density across the whole genome (see Methods). P-values were calculated using the KS-test.


