
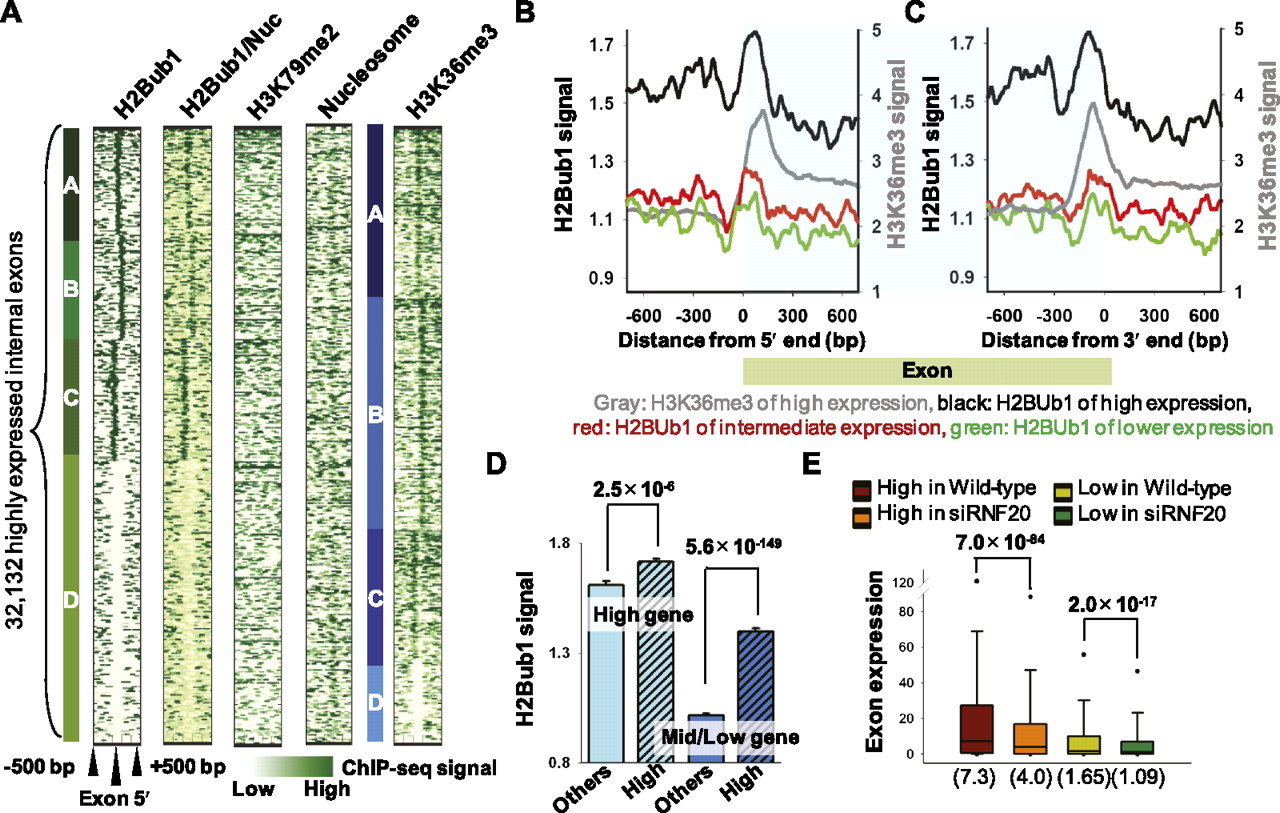
H2Bub1 is enriched at the exon boundaries. Internal exons separated from flanking exons by at least 500 bp (n = 107,107) were considered. (A) Clustered exon boundary patterns 500 bp upstream of and downstream from the 5′ end of the exons are shown. H2Bub1/Nuc indicates the H2Bub1 patterns obtained following normalization with respect to nucleosome occupancy. (B,C) Average H2Bub1 signals at the exon 5′ and 3′ ends according to exon expression levels. Similar to the H3K36me3 signals of highly expressed exons (gray lines), H2Bub1 was enriched at the exon boundaries of highly expressed exons (black lines). (X-axis) Relative position (bp) from each 5′ and 3′ end. (D) Average H2Bub1 signals of highly expressed exons in both highly expressed genes and middle/lower expressed genes are shown with standard deviation error bars (y-axis). (High) Highly expressed exons (top 30%) in each gene expression group; (Others) remaining exons. P-values were calculated using the Student's t-test. (E) Boxplots of exon expression changes between wild-type and siRNF20-transfected NCCIT cells. The H2Bub1-enriched (top 30%, n = 32,132) and H2Bu1-depleted (bottom 30%, n = 32,132) exons were defined according to the H2Bub1 signal for each exon. The parentheses indicate median values.


