
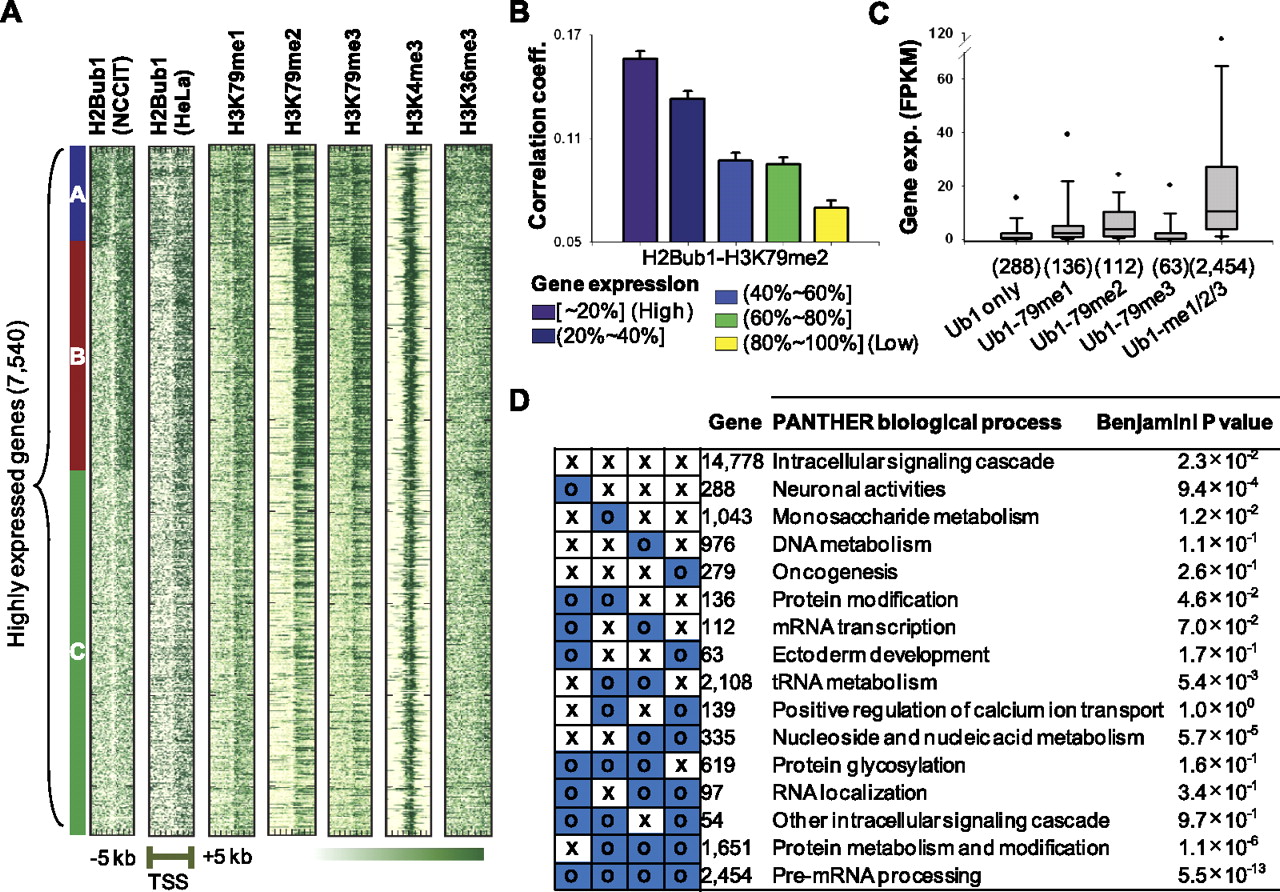
Genome-wide correlation patterns between H2Bub1 and H3K79 methylations. (A) Three distinct H2Bub1 patterns were identified for highly expressed genes (top 30%, 7540) in the regions surrounding the TSS, as assessed by k-means clustering. Other modification patterns are presented in the gene order shown for H2Bub1. Cluster A shows strongly enriched bidirectional patterns, while both clusters B and C were enriched downstream from the TSS. (B) The correlation patterns between H3K79me2 and H2Bub1 affected gene activation. Genes were divided into five groups according to their gene expression levels (purple: highly expressed genes; yellow: lower expressed genes). Pearson correlation coefficients were calculated between H3K79 methylations and H2Bub1 within each gene. (Y-axis) Average correlation coefficient of each group. (C) Boxplots of gene expression levels in FPKM scores for different combinations of H2Bub1- and H3K79-methylation-targeted genes. Modification-targeted genes were defined as those containing at least one corresponding modification peak. (Values in parentheses) Number of genes. (D) Gene set analysis for all combinations of H2Bub1- and H3K79 methylation-targeted genes using DAVID. PANTHER biological processes are presented with corrected P-values.


