
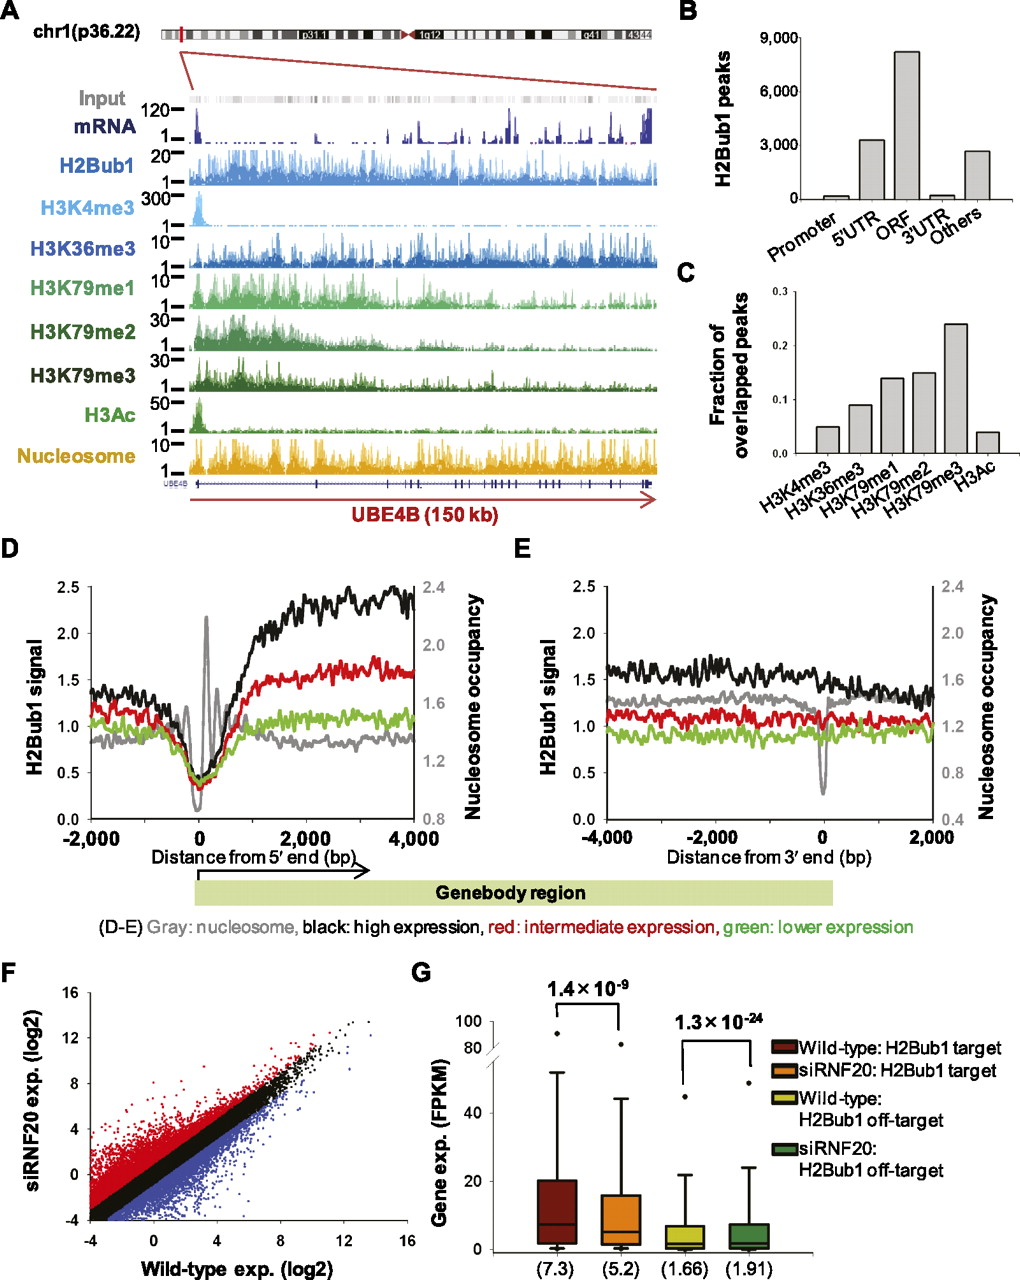
Varying genomic properties of the H2Bub1-enriched regions. (A) The ChIP-seq results for UBE4B (ubiquitin conjugation factor E4B) are shown. (Y-axis) Read counts of the sequence tags in 30-bp increments. H2Bub1 was enriched at the 5′ end and gradually decreased along the transcribed region, similar to the methylation pattern of H3K79. (B) MACS analysis recognized 14,679 H2Bub1 peaks and assigned them to 4173 genes. (C) The H2Bub1 peaks overlapped with the H3K79me3 peaks (24% of the H3K79me3 peaks) in 2765 genes. (D,E) H2Bub1 signals in the regions surrounding the transcription start site (TSS) and transcription end site (TES). (Y-axis) H2Bub1 signal; (x-axis) relative position (bp). Nucleosomes were well positioned in the regions surrounding the TSS, while H2Bub1 signals were depleted in these regions. The gene expression levels were divided into three groups: highly expressed (black lines, top 30%), lower expressed (green lines, bottom 30%), and intermediately expressed (red lines, middle 40%). (F) Comparison of gene expression changes between wild-type and siRNF20-transfected NCCIT cells. (Red and blue) Genes demonstrating twofold or more up-regulation and down-regulation, respectively. (G) Gene expression changes among the H2Bub1-targeted genes. Among ∼25,000 genes, 3824 were H2Bub1-targeted genes, and the remaining 21,310 genes were defined as H2Bub1 off-targeted genes. P-values were calculated using the Kolmogorov-Smirnov (KS) test (Stephens 1970). Parentheses indicate median values.


