
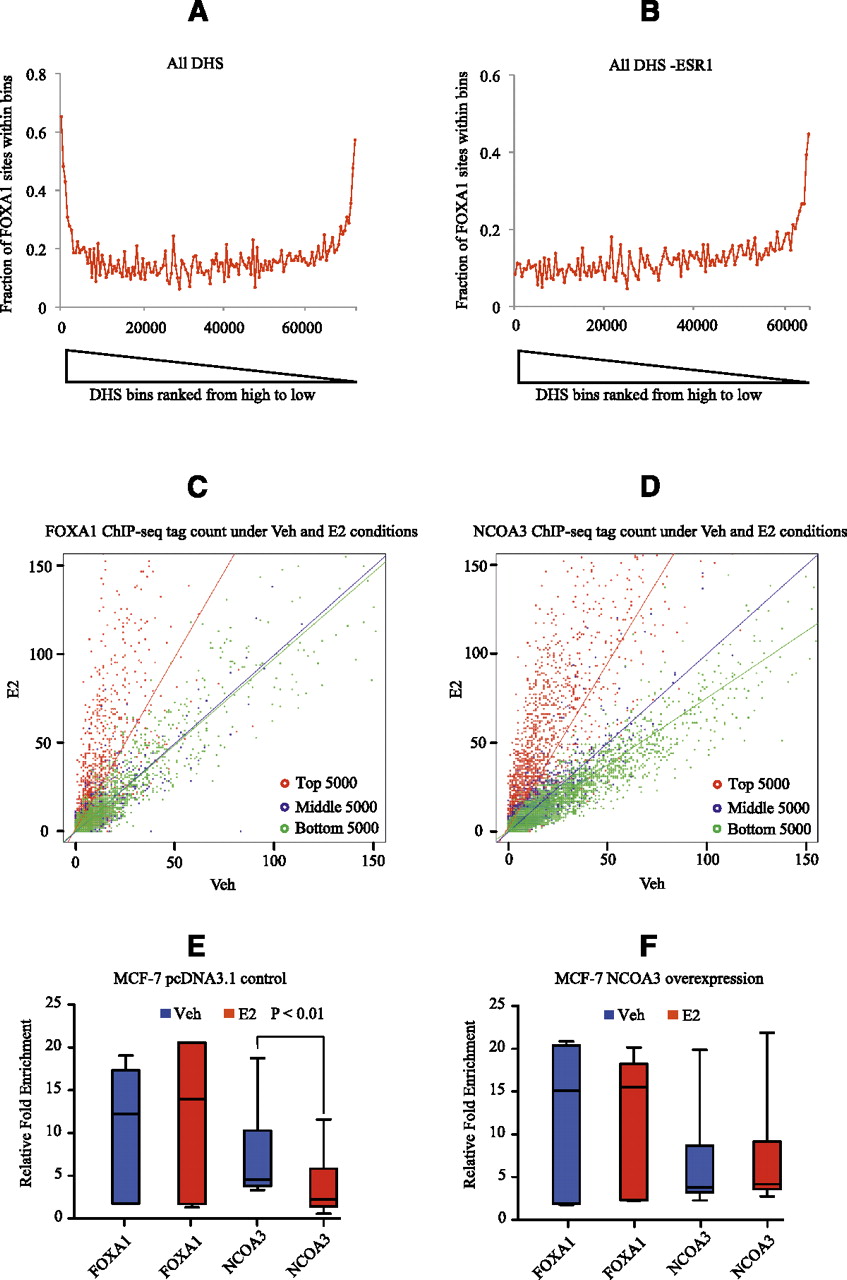
DNase I hypersensitivity changes at FOXA1 and NCOA3 sites. Association of ΔDHS with FOXA1 sites in the presence (A) and absence (B) of ESR1 binding. MCF-7 DHS in the estrogen-stimulated condition were ranked in descending order based on the ΔDHS score. These ranked regions are grouped into bins of 500. (Y-axis) Fraction of regions that overlap with FOXA1 ChIP-seq enriched regions. Scatter plots of FOXA1 (C) and NCOA3 (D) ChIP-seq tag counts in the stimulated condition compared with counts in the unstimulated condition. Three groups of 5000 DHS sites were selected from the MCF-7 estrogen-stimulated DHS sites: DHS-increased (red), DHS-unchanged (blue), and DHS-diminished (green). Regression lines were drawn for each of the groups. The steeper the slope of a regression line, the greater the binding of the factor in the E2-stimulated condition relative to the unstimulated condition. While the slope for FOXA1 in the DHS-diminished category is not significantly different from that in the DHS-unchanged category, the slope for NCOA3 in the DHS-diminished category is less than that for the DHS-unchanged category. This means that within the DHS-diminished category NCOA3 binding tends to decrease on E2 stimulation while FOXA1 binding is maintained at the same level. Changes of FOXA1 and NCOA3 binding strength at FOXA1 binding sites in the overexpression control (E) and NCOA3 overexpression (F) samples under stimulated and unstimulated conditions. Six FOXA1 binding sites were selected from the hormone-diminished DHS sites. Box plots were generated from the ChIP-qPCR data of the six sites tested. The individual ChIP-qPCR assays are shown in Supplemental Figure 10.


