
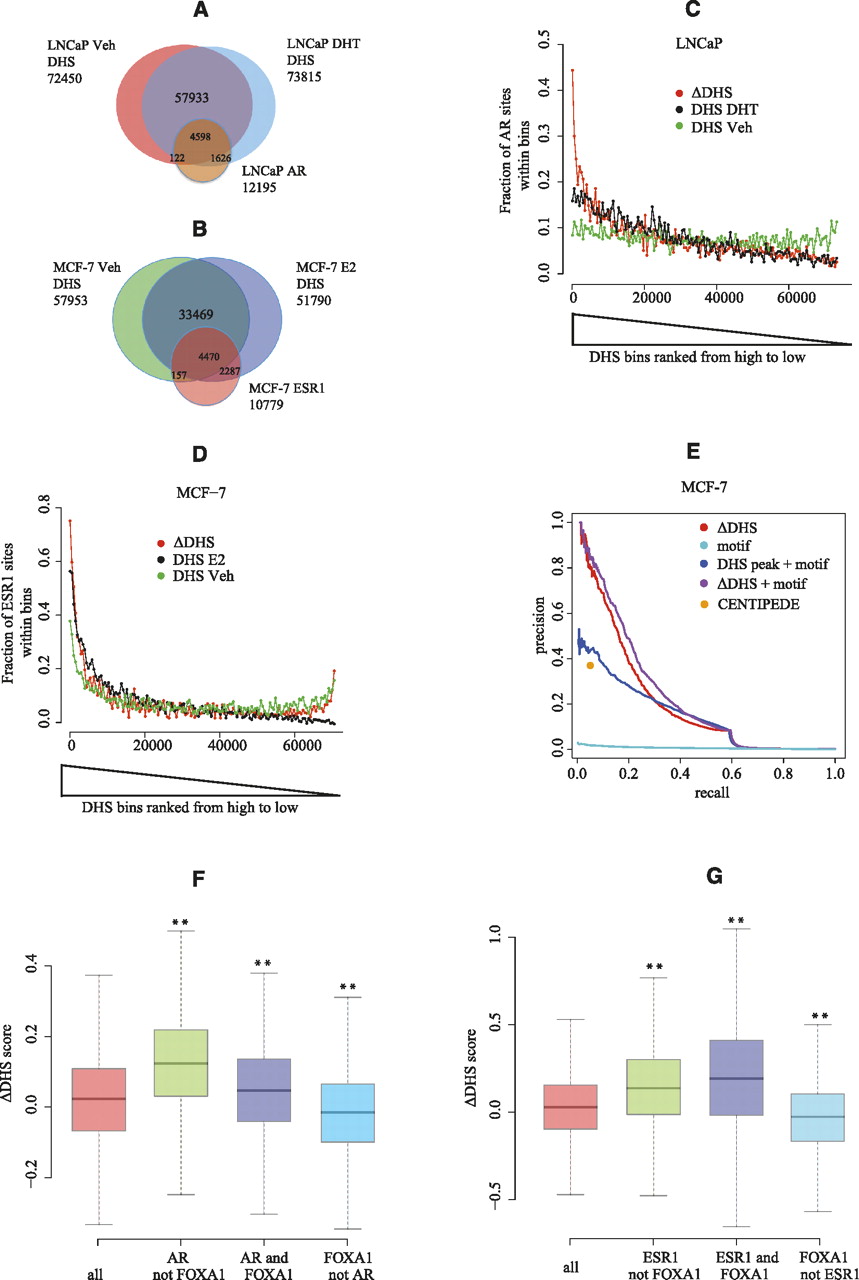
Characteristics of DNase I hypersensitivity sequencing. (A) Venn diagram of the DHS and AR peaks in LNCaP. The DNase-seq sequencing depth was normalized to the lower sequencing depth for the unstimulated (50 M) and androgen-stimulated (70 M) conditions. (B) Venn diagram of the DHS and ESR1 peaks in MCF-7. DNase-seq sequencing depth was normalized to the lower sequencing depth of the unstimulated (28 M) and estrogen-stimulated (70 M) conditions. (C,D) The fraction of LNCaP AR (C) or MCF-7 ESR1 (D) binding sites in bins ranked by three measures: DNase-seq tag counts in stimulated and unstimulated conditions and a score, ΔDHS, representing the change in DNase I hypersensitivity between the two conditions. The DNase-seq peak regions under the stimulated condition are ranked by these measures. To calculate the proportion of real binding sites as a function of rank, these ranked regions are grouped into bins of 500. (Y-axis) Fraction of regions in each bin that overlap with AR (C) or ESR1 (D) ChIP-seq enriched regions. (E) The precision-recall curves for prediction power of MCF-7 ESR1 binding sites were calculated by five measures: ΔDHS, ESR1 motif, ESR1 motif in E2 DHS, sqrt([ΔDHS rank]*[motif rank]), and results generated by the CENTIPEDE algorithm on ENCODE MCF-7 DNase-seq data (see Methods). (F,G) Box plots showing the distribution of the DNase-seq change (ΔDHS) between the unstimulated and stimulated conditions in LNCaP (F) and MCF-7 (G) cells. “All” represents all the DHS sites in MCF-7 and LNCaP; “AR not FOXA1” and “ESR1 not FOXA1” represent AR and ESR1 binding sites that do not overlap with FOXA1; “AR and FOXA1” and “ESR1 and FOXA1” represent AR and ESR1 binding sites that overlap with FOXA1; “FOXA1 not AR” and “FOXA1 not ESR1” represent FOXA1 binding sites that do not overlap with AR and ESR1. (**) Wilcoxon rank-sum test P-values <0.01, comparing “all” with the other categories.


