
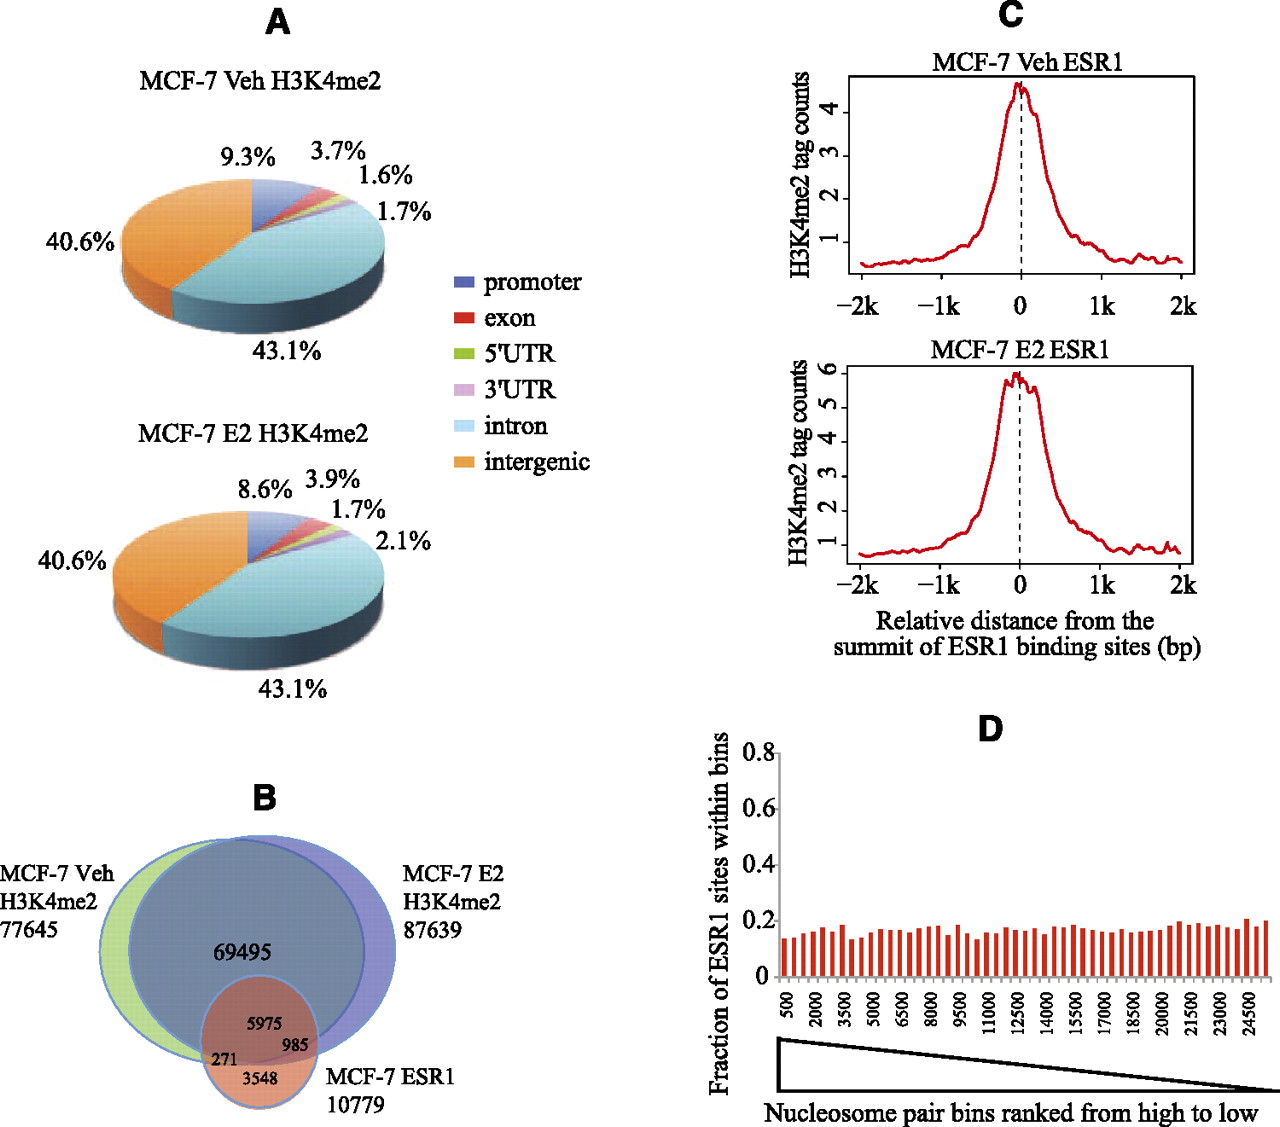
Characteristics of H3K4me2 ChIP-seq in MCF-7 cells. (A) Location of H3K4me2 ChIP-enriched peaks relative to gene annotations in unstimulated (Veh) and estrogen-stimulated (E2) conditions. (B) Venn diagram of ESR1 binding loci in relation to H3K4me2-enriched regions. (C) Distribution of H3K4me2 ChIP-seq signal at non-promoter (>1 kb from TSSs) ESR1 binding sites under unstimulated and estrogen-stimulated conditions. (D) The fraction of ESR1 binding sites in paired nucleosome bins sorted in descending order by NSD score (stimulated vs. unstimulated). Paired nucleosome regions are ranked by the NSD score that represents the differences in the H3K4me2 tag counts before and after estrogen treatment. These ranked regions are grouped into bins of 500 to calculate the proportion of real binding sites as a function of rank. (Y-axis) Fraction of the regions in each bin that overlap with ESR1 ChIP-seq enriched regions.


