
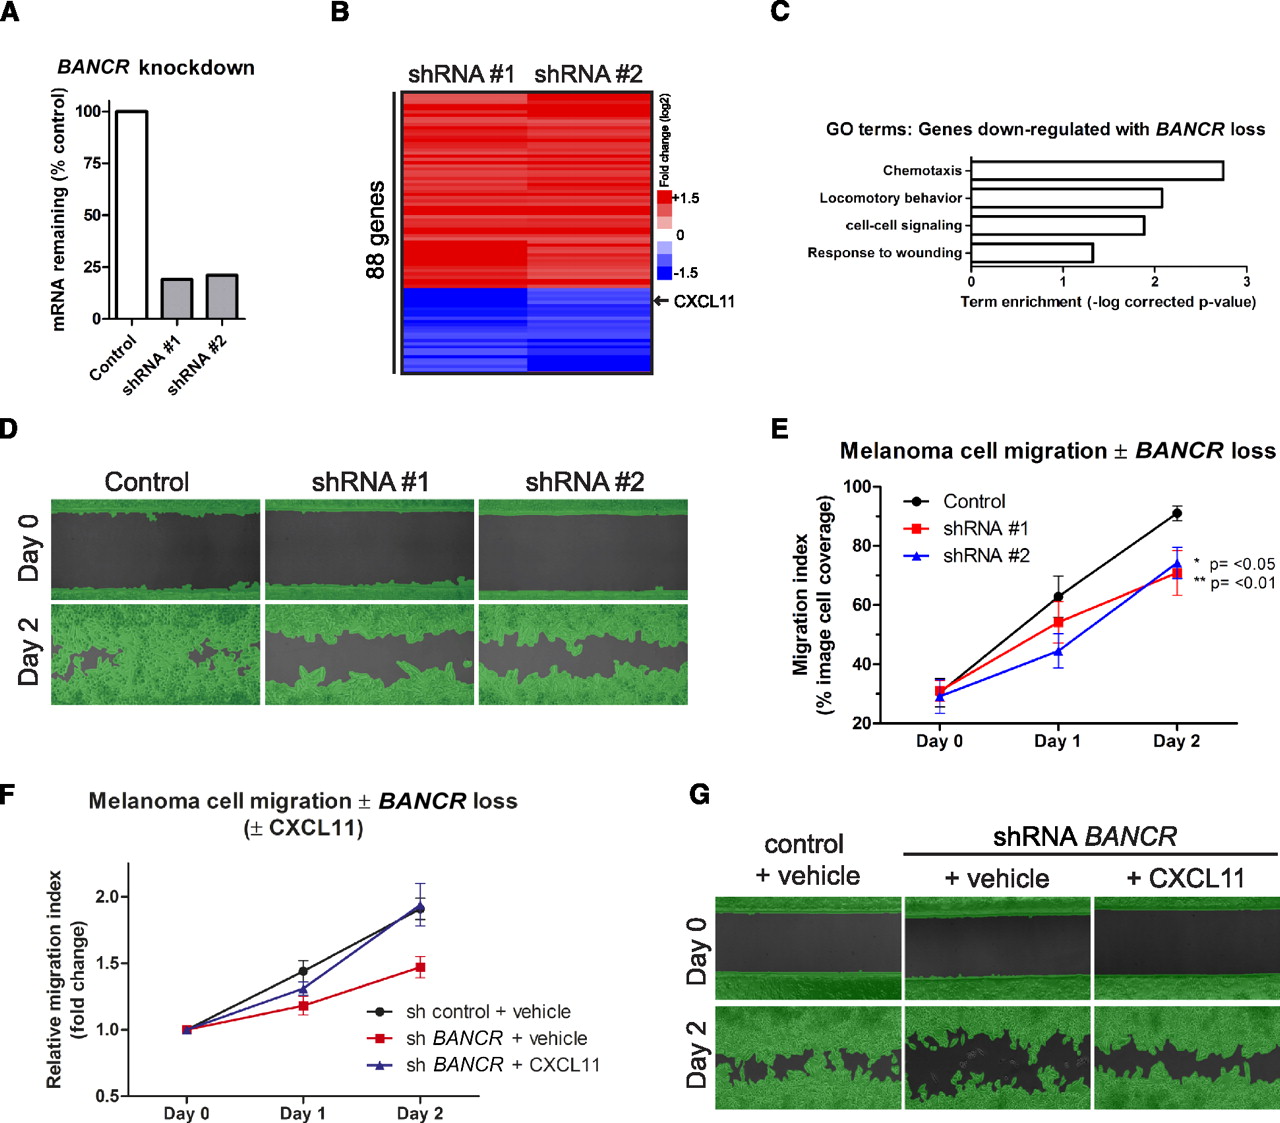
BANCR loss impairs melanoma cell migration. (A) Quantification of BANCR knockdown by qPCR using two independent shRNAs. (B) Microarray analysis of Colo829 melanoma cells following shRNA knockdown of BANCR. (C) Significant gene ontology (GO) terms associated with genes repressed by BANCR loss. (D) Representative images showing amount of cell migration at day 0 and day 2. Melanoma cells were infected with lentivirus expressing either nontargeting control shRNA (control) or one of two duplicate independent shRNA sequences targeting BANCR (shRNA 1, shRNA 2). Green highlight, shown for clarity, is a mask applied by the analysis software for accurate, unbiased migration quantification. (E) Quantification of replicate images (n = 6 per timepoint) taken over migration assay timecourse. Values are means from two independent experiments ± SD. Statistical analysis performed by one-way ANOVA, **P ≤ 0.01, *P ≤ 0.05 versus control. (E) Quantification of replicate images (n = 3 per timepoint) taken over migration assay timecourse ± CXCL11. Cells were infected with shRNA control lentivirus and treated with vehicle (PBS), infected with BANCR shRNA, and treated with vehicle or infected with BANCR shRNA and treated with CXCL11 (10 ng/mL). (G) Representative images showing amount of cell migration at day 0 and day 2.


