
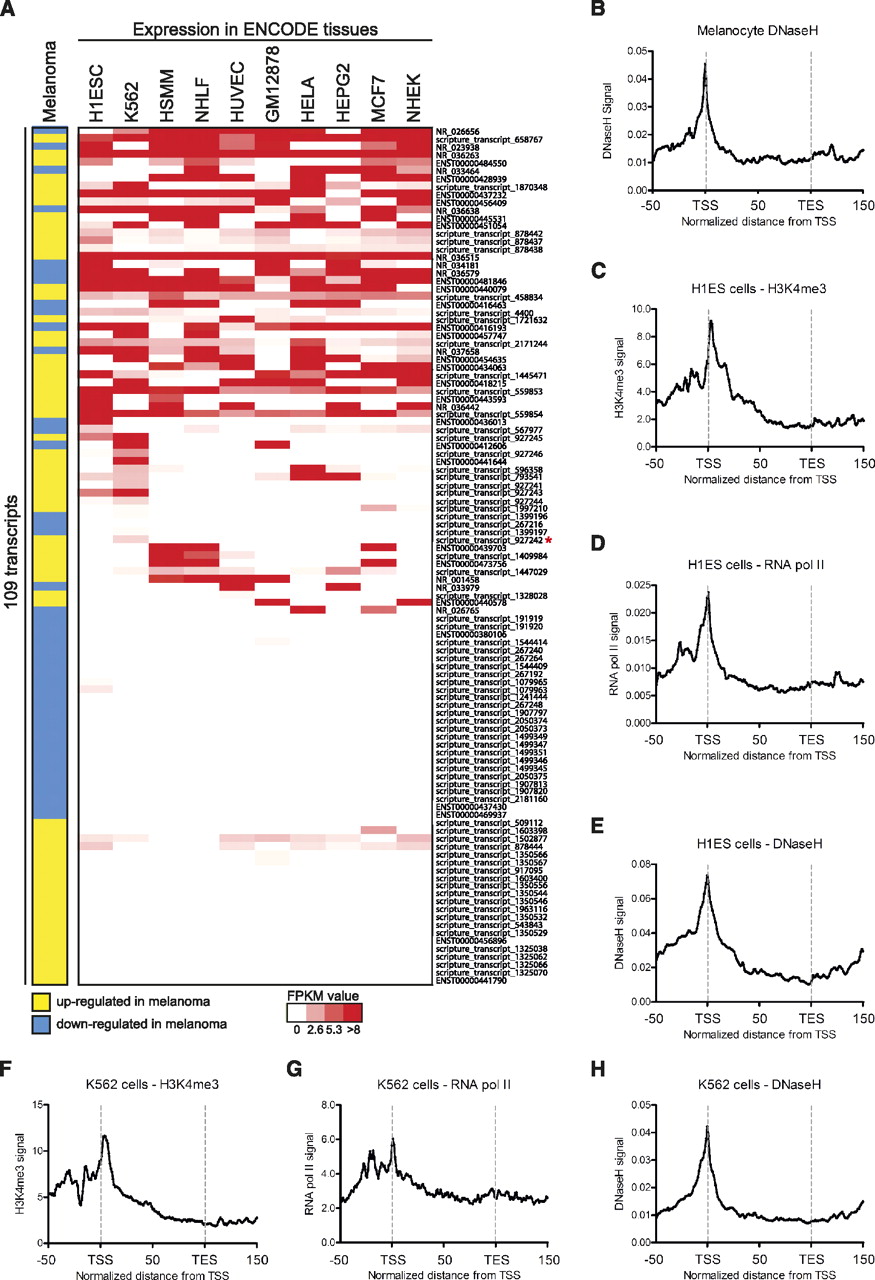
Multi-tissue expression profile of annotated lncRNAs and novel transcripts. (A) Publicly available RNA-seq data (ENCODE project) for multiple cell types were downloaded from the UCSC Genome Browser. The melanoma column expresses an aggregate from our RNA-seq data indicating if each transcript was concordantly up-regulated (yellow) or down-regulated (blue) by BRAF in melanoma. Red/white scaling indicates expression level in other cell types. (B) Melanocyte DNaseH (ENCODE) distribution over the 109 BRAF-regulated transcripts is shown. The following charts (C–H) depict signal distribution (ENCODE) over the 109 BRAF-regulated transcripts. (C) Distribution of H3K4me3 in H1ES cells. (D) Distribution of RNA pol II in H1ES cells. (E) Distribution of DNaseH in H1ES cells. (F) Distribution of H3K4me3 in K562 cells. (G) Distribution of RNA pol II in K562 cells. (H) Distribution of DNaseH in K562 cells. (TSS) Transcription start site; (TES) transcription end site.


