
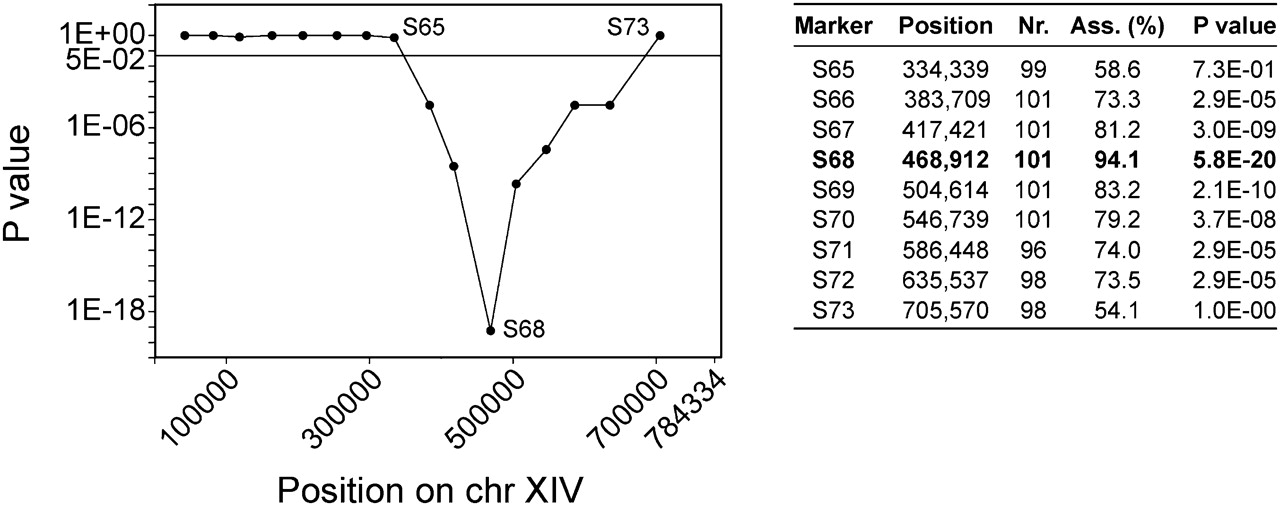
Figure 3.
Detailed linkage statistics of QTL3, the locus with the strongest linkage to high ethanol tolerance. The table shows for each marker in the mapped QTL3 on chromosome XIV the position of the marker, the number of segregants in which the marker was scored, the association percentage, and the P-value. The association percentage represents the percentage of segregants with VR1-5B inheritance, i.e., the nucleotide from VR1-5B. The marker with the strongest linkage is shown in bold.


