
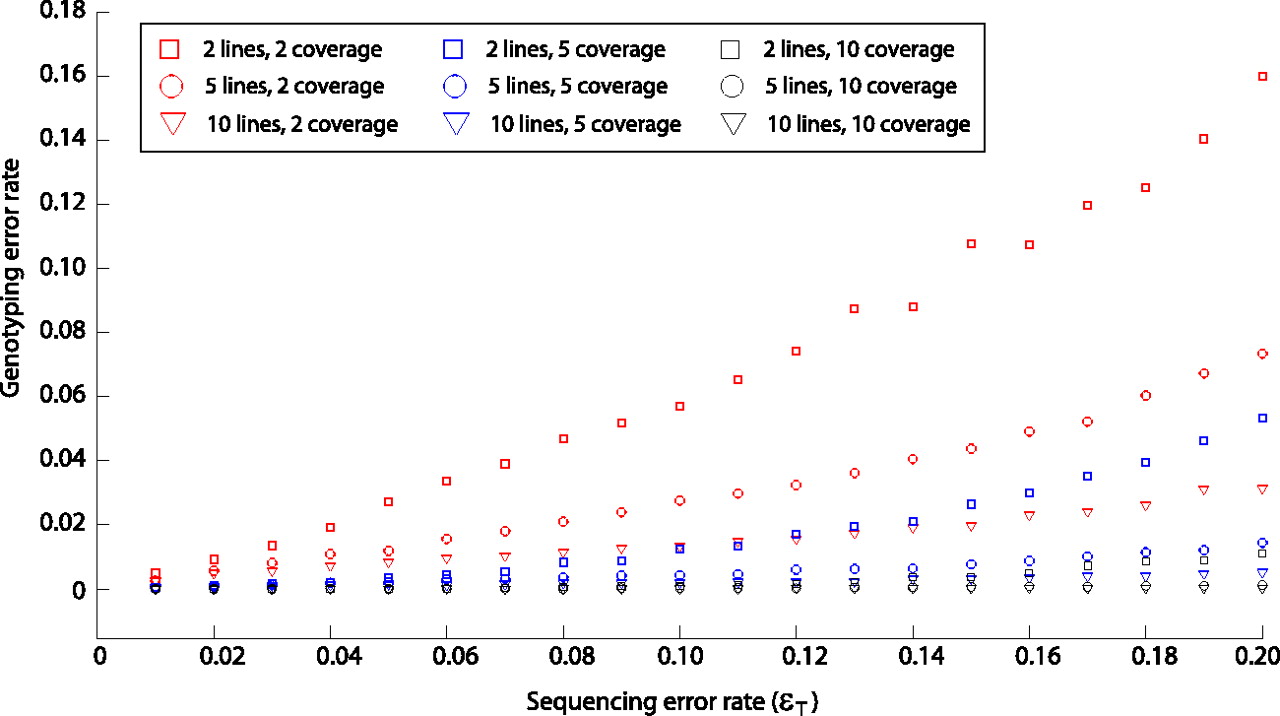
Figure 6.
Genotyping error rate as a function of sequencing error rate, coverage, and sample size. At a single site, sequencing read data were simulated for either two (square), five (circle), or 10 (triangle) lines assumed to be homozygous for the nucleotide A. These were considered in combination with simulated coverage of either two reads (red), five reads (blue), or 10 reads (black). For sequencing error rates ranging from 0.01 to 0.20, the JGIL genotyping error rate was calculated across 10,000 replicate simulations.


