
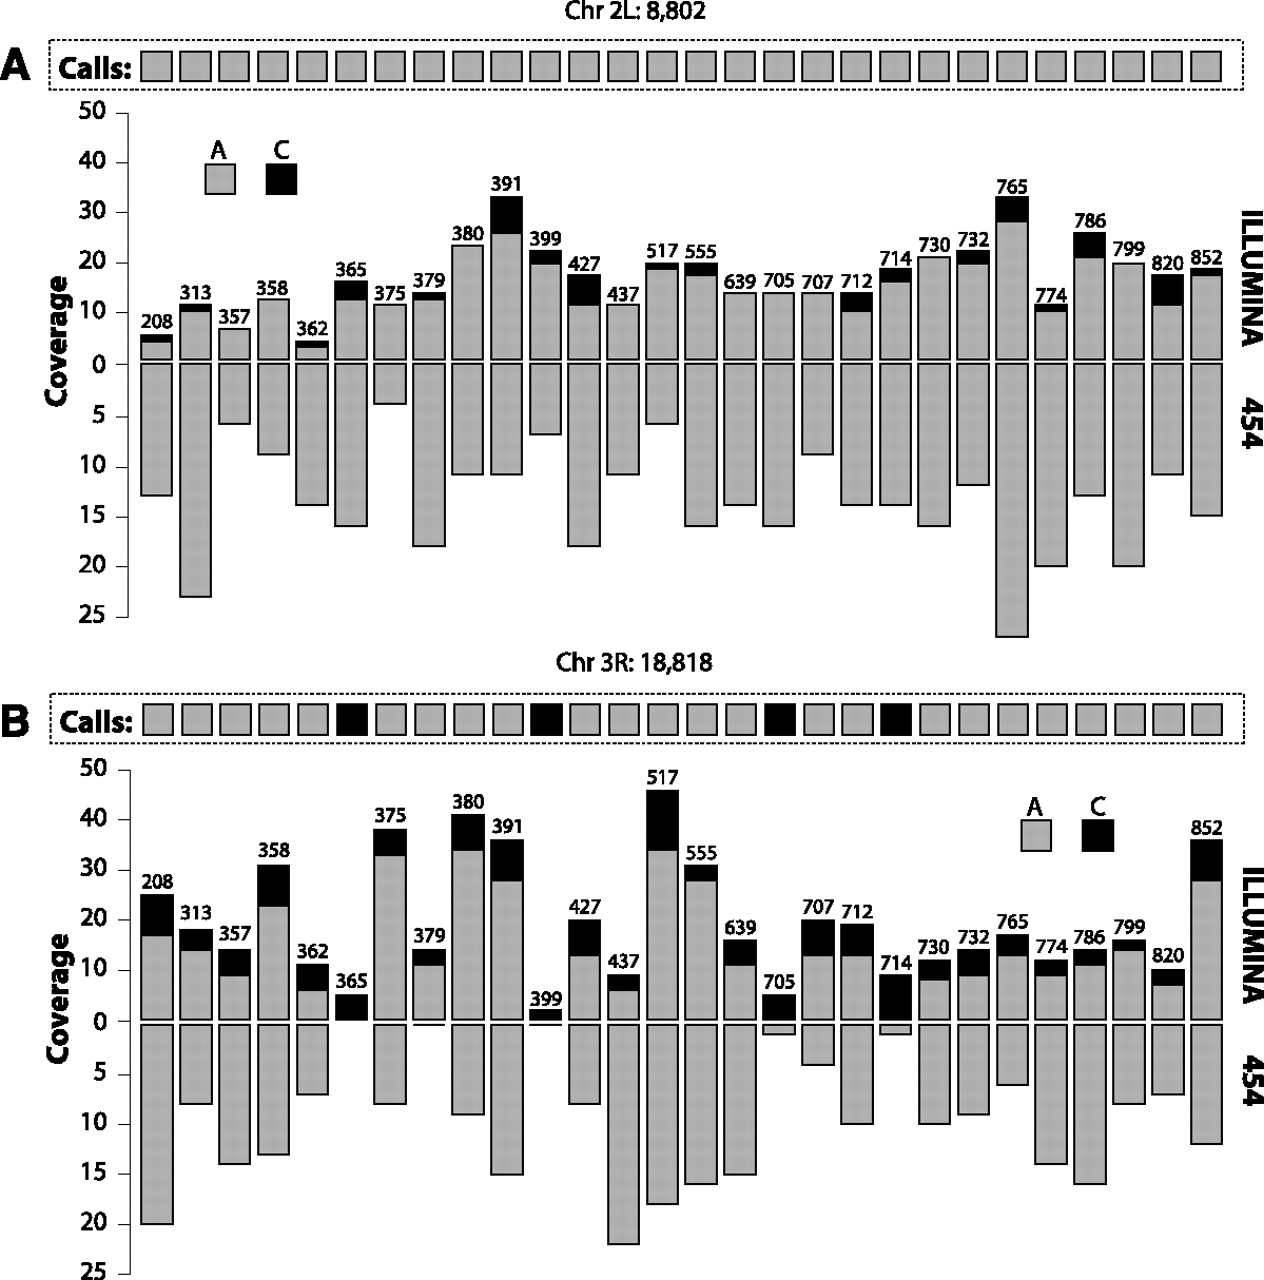
Two examples of JGIL applied to the DGRP. (A) Data for chromosome 2L, position 8802 generated on two sequencing platforms for 28 DGRP lines. Each vertical bar summarizes the data for one line from both the Illumina GAII (oriented upward) and the Roche 454 machines (oriented downward). The height of the bar indicates coverage and is partitioned into counts of A (gray) and C (black). Each bar is labeled with the index of its corresponding line. Note that every 454 read shows an A, strongly suggesting that the Illumina C reads are erroneous. (B) As in panel A for chromosome 3R, position 18818. Based on the Illumina data, JGIL assigns to four of the lines (365, 399, 705, 714) a homozygous C genotype, but this is not supported by the 454 data.


