
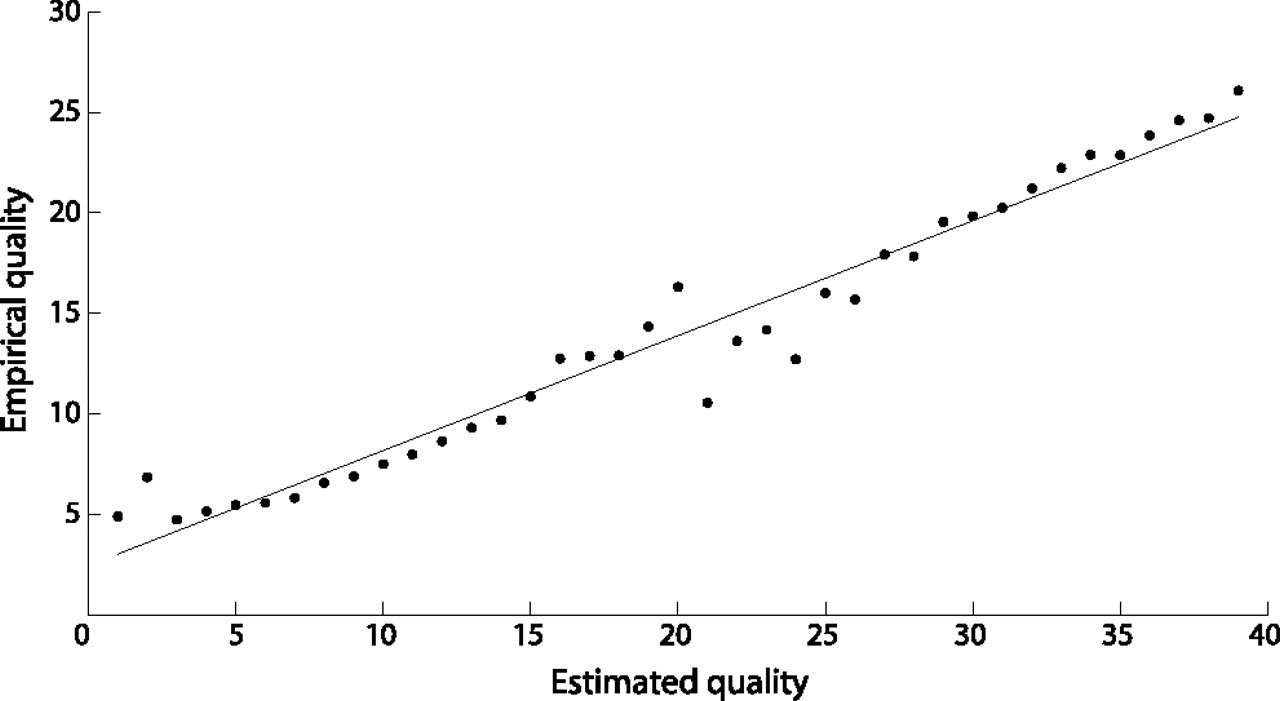
Figure 4.
Empirical quality versus estimated quality. The genotype calls for replicate lines RAL_554 and RAL_555 were compared after stratification by minimum quality score (estimated quality, x-axis). Within each stratum, the proportion of sites for which the two calls agreed was calculated and converted to a quality (empirical quality, y-axis). The regression of empirical quality on estimated quality (black line) is highly significant (R2 = 0.9596; p ≈ 0). Quality scores were truncated at 40 and do not appear in the plot; the empirical quality among all sites with estimated quality Q ≥ 40 was 47 (data not shown).


