
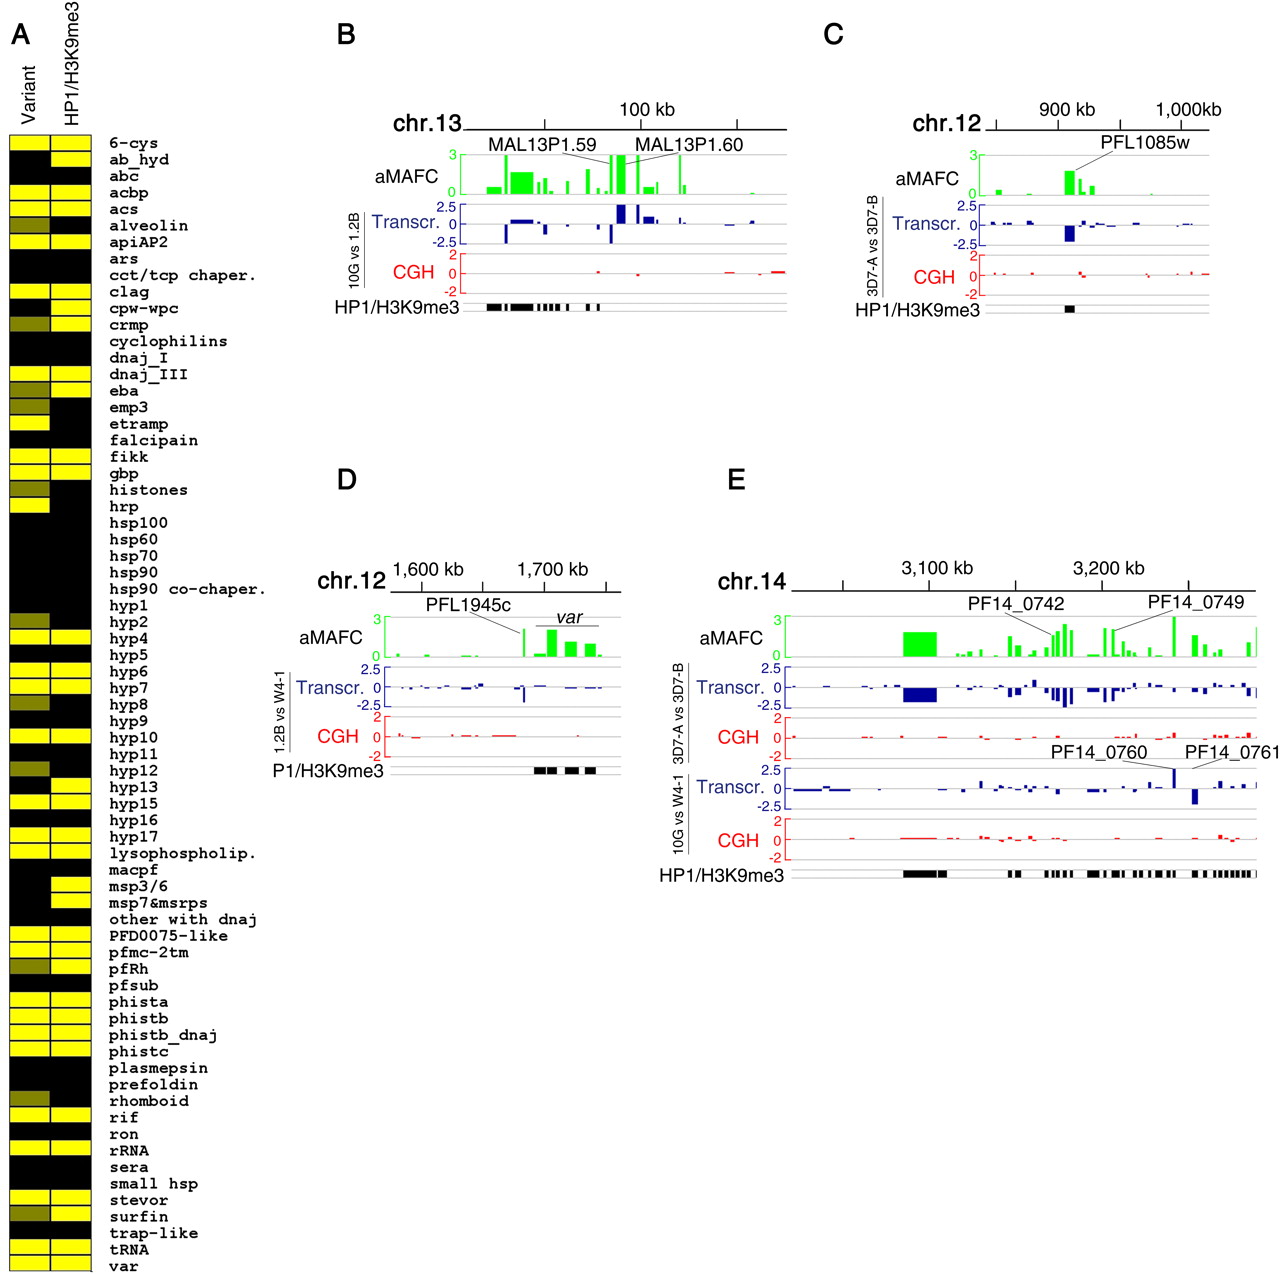
Heterochromatin-based regulation of variant expression. (A) Correlation between variant expression and heterochromatin marks at the gene family level. (Yellow) Gene families (described in Supplemental Table S4) with at least one member showing variant expression (“Variant” column) or positive for heterochromatin marks (“HP1/H3K9me3” column) in any of the published studies (Flueck et al. 2009; Lopez-Rubio et al. 2009; Salcedo-Amaya et al. 2009). (Dark yellow) Gene families with only one gene showing variant expression in only one of the comparisons (gene families not included in Table 1). (B–E) Chromosomal distribution of variantly expressed genes. (Top lane, green) The log2 of the aMAFC in the 3D7 comparison. The other lanes represent the relative transcript (blue) and gDNA (red) levels in pairwise parasite line comparisons, expressed as the log2 ratio of the fold-change. (Bottom lane, black) HP1- or H3K9me3-positive genes.


