
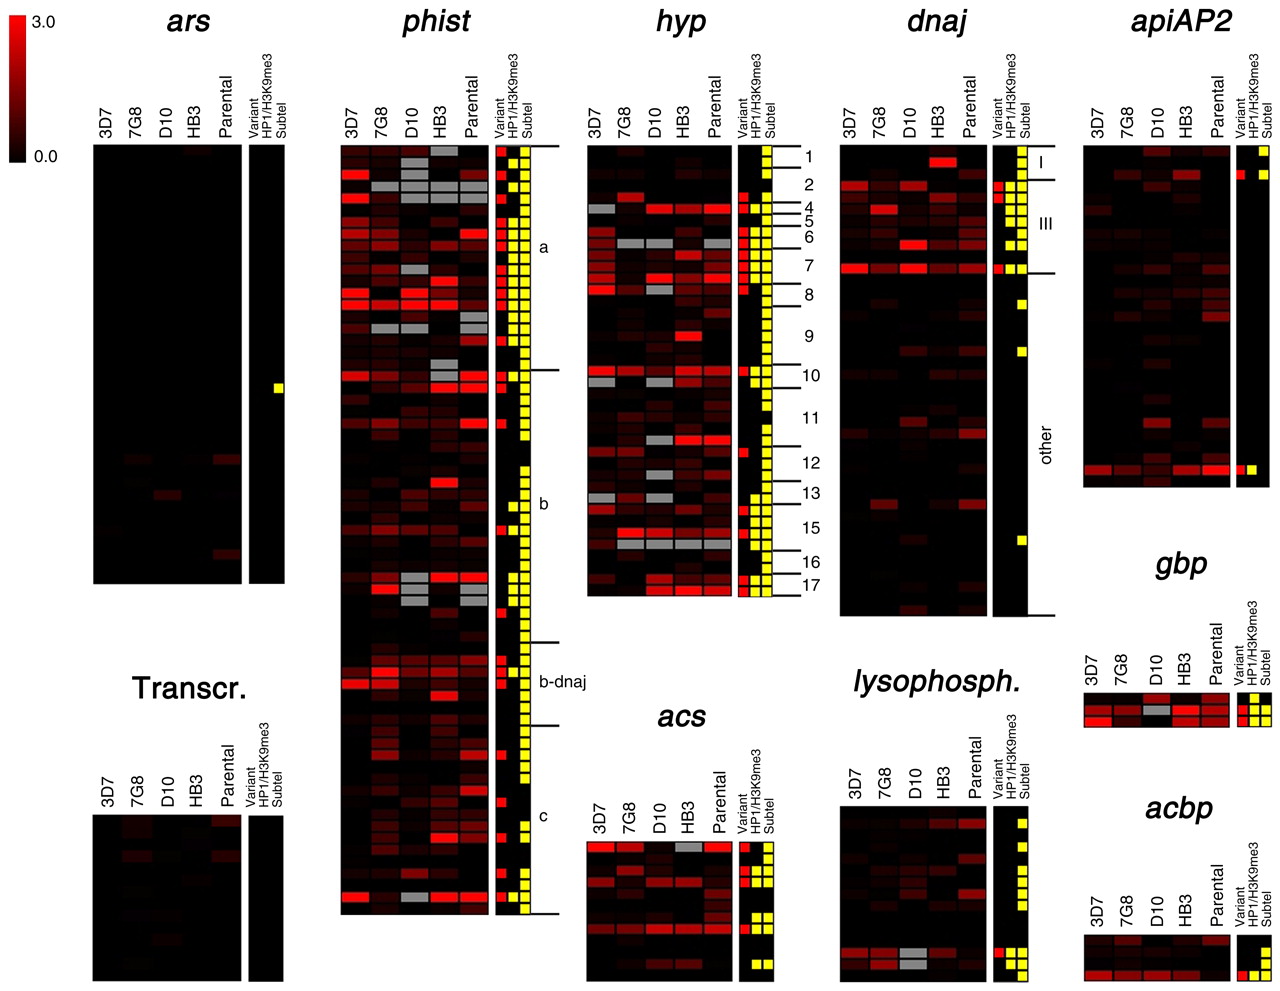
Distribution of variant expression in P. falciparum gene families. The log2 of the aMAFC for each comparison is shown for the genes of selected families. Aminoacyl-tRNA-synthetases (ars) and genes encoding the basal transcription machinery (Transcr.) (Bischoff and Vaquero 2010) provide appropriate controls as gene sets encoding essential genes, for which variant expression is not expected. For phist, hyp, and dnaj families, the specific family identity is indicated at the right of the heatmaps. Gene families are detailed in Supplemental Table S4. The tracks at the right indicate whether a gene was included in the list of variant genes (Supplemental Table S2), whether it was positive for heterochromatin marks HP1 or H3K9me3 in any of the published reports (Flueck et al. 2009; Lopez-Rubio et al. 2009; Salcedo-Amaya et al. 2009), and whether it is subtelomerically located (<150 kb from a chromosome end). Genes that show high aMAFC in some of the tracks but are not in the list of variant genes were excluded because changes in expression were attributable to CNVs, or for other reasons detailed in the text.


