
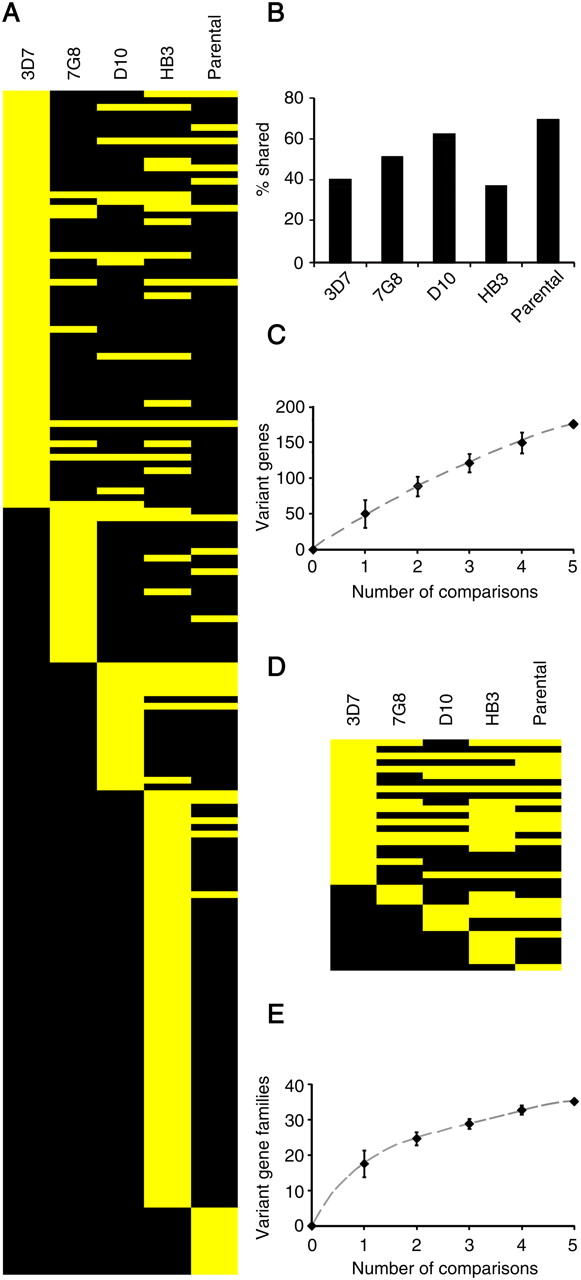
Overlap in the variantly expressed genes identified in the different comparisons. (A) Genes (in rows) that showed variant expression in the 3D7, 7G8, D10, HB3, or parental comparisons are shown in yellow in the corresponding lane. Genes from the var, rif, stevor, and pfmc-2tm families were excluded from this analysis, because they were only analyzed in the 3D7 comparison. (B) Percentage of variant genes identified in each comparison that showed variant expression in at least one other comparison. (C) Cumulative number of variantly expressed genes identified with increasing number of comparisons. Values are the average, with 95% ci, of all possible combinations of comparisons. (D,E) Same as panels A and C, but at the gene family level. Gene families are defined in Supplemental Table S4.


