
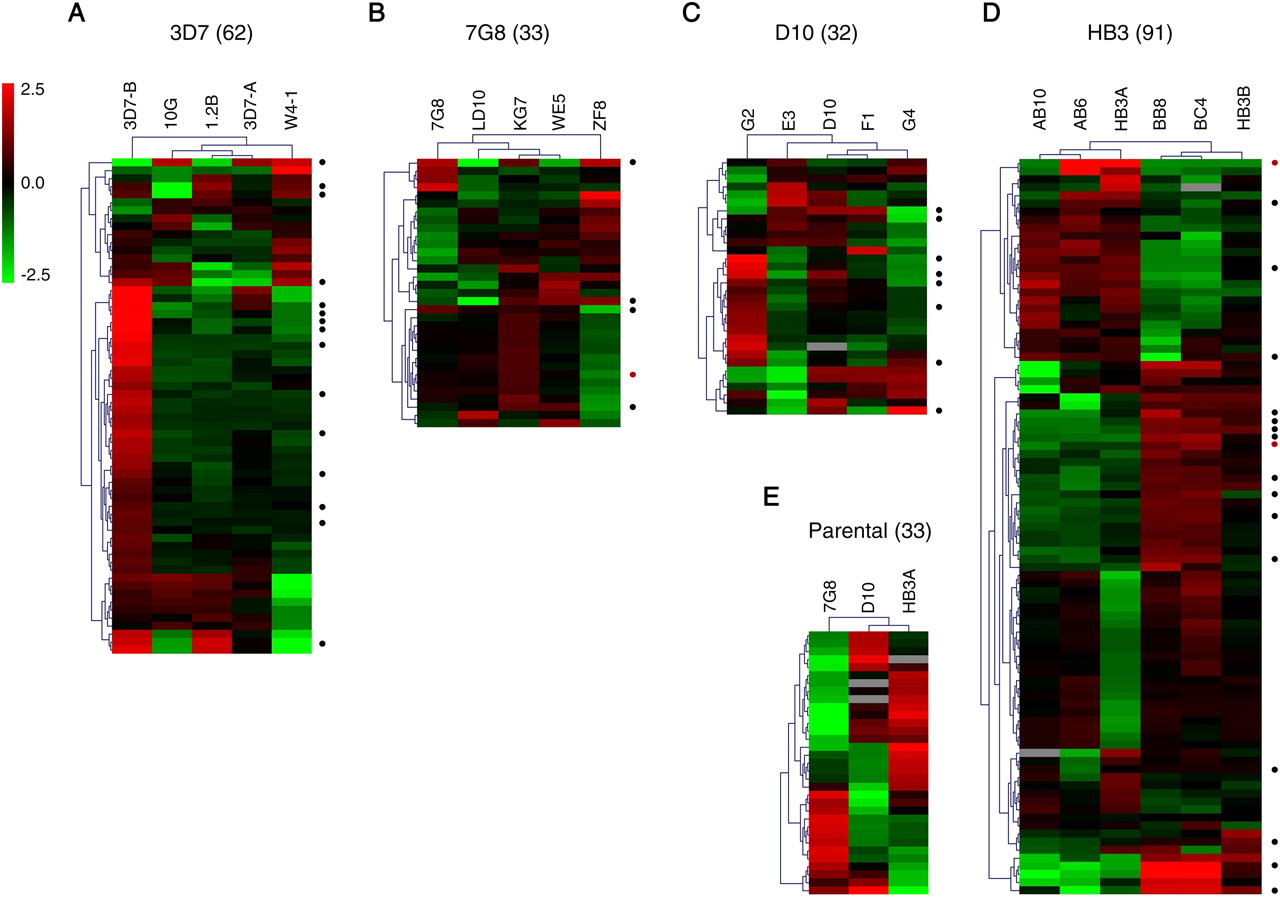
Overview of genes showing transcriptional variability. Expression patterns are shown for the clonally variant genes identified in the 3D7 (A), 7G8 (B), D10 (C), HB3 (D), and parental lines (E) comparisons. The numbers in parenthesis indicate the number of variant genes in each comparison. Genes from the var, rif, stevor, and pfmc-2tm families are not included in the 3D7 heatmap, to make it comparable with the other parasite lines. Values are the log2 of the expression fold-change relative to the average expression in the parasite lines within each comparison. (Black dots) Genes showing the same transcriptional patterns in qPCR analysis of independent biological preparations; (red dots) genes that showed different patterns (Supplemental Fig. S8; Supplemental Table S3).


