
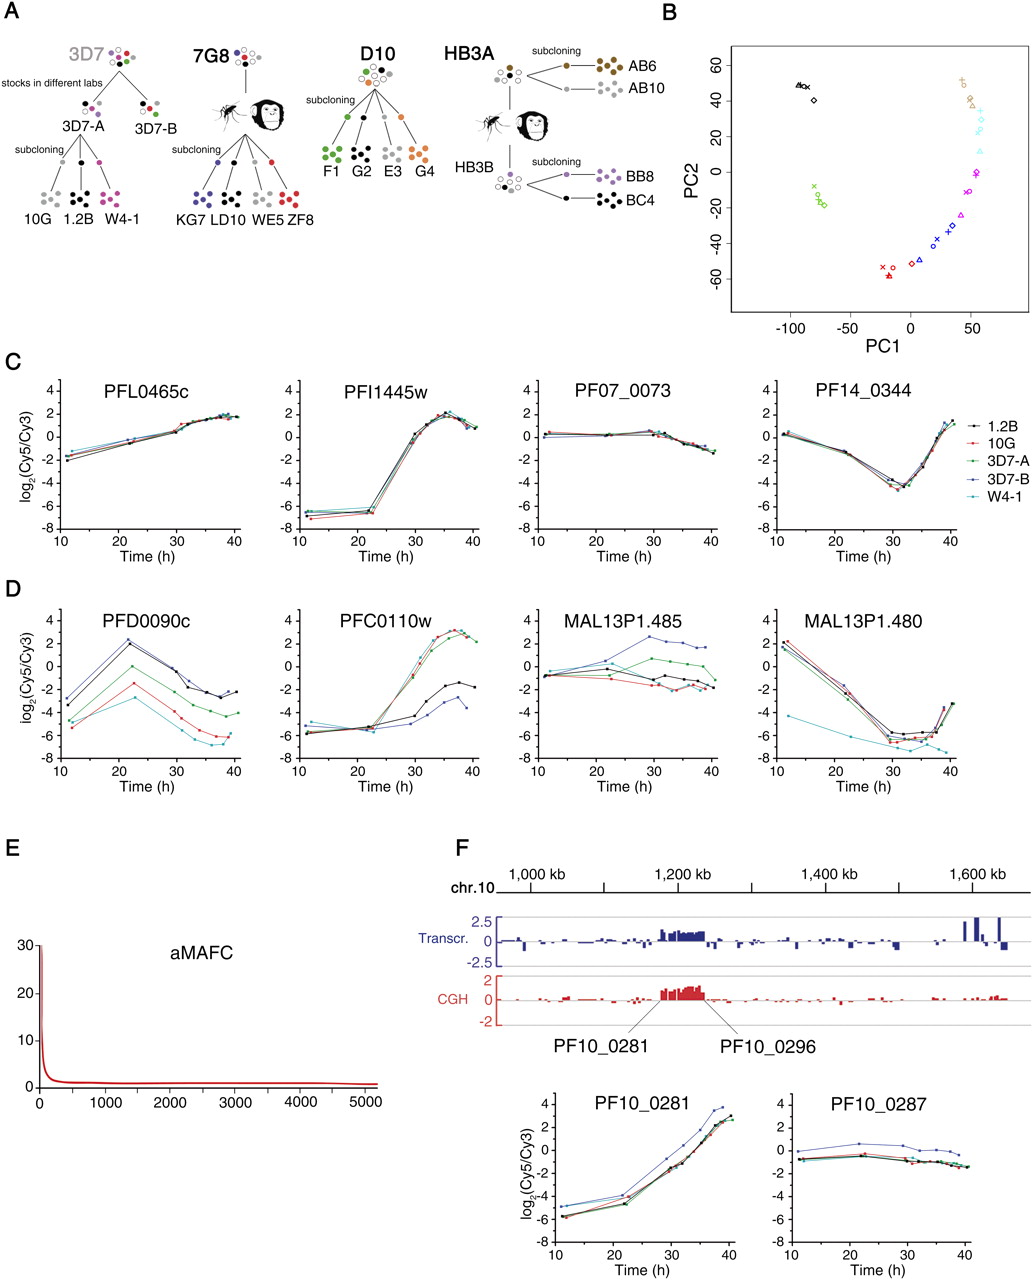
Identification of genes under clonally variant expression. (A) Parasite lines used in this study. Parental parasite lines 3D7, 7G8, D10, and HB3A are of clonal origin. 3D7-A and 3D7-B are stocks of 3D7 maintained in different laboratories for some years (Cortés et al. 2004). 7G8 subclones were identified as self-fertilization events after passage through mosquito and splectomized chimpanzee (Hayton et al. 2008). HB3B was derived from self-crossing HB3A (Walliker et al. 1987). Parentals comparison included the three parental parasite lines shown in bold (7G8, D10, and HB3A). (B) Principal component analysis (PCA) of the time-course transcriptional analysis of 3D7 parasite lines. Samples from the same parasite line are represented by the same symbol, whereas samples collected at the same time point are represented by the same color. (C) Time-course expression plots of representative genes not showing clonally variant expression. Expression levels (log2 ratio of expression relative to the reference pool) are plotted against statistically estimated culture age (in hours post-invasion). The first gene has the median aMAFC, whereas the other three genes are single-copy genes commonly used as controls (rhopH2, seryl tRNA synthetase, and ptex150, in this order). (D) Time-course expression plots, as in C, but for genes showing clonally variant expression. The genes belong to the phista, clag, acs, and hrp families, in this order. (E) Distribution of aMAFC. Genes (x-axis) are ranked by their aMAFC in descending order. (F) Duplication of a region of chromosome 10 in 3D7-B. Transcript (blue) and gDNA (red) levels in 3D7-B relative to 3D7-A (log2 ratio) are shown for the second half of chromosome 10. The names of the first and last genes duplicated in 3D7-B are shown. Time-course expression plots for two of the genes within the duplication are shown.


