
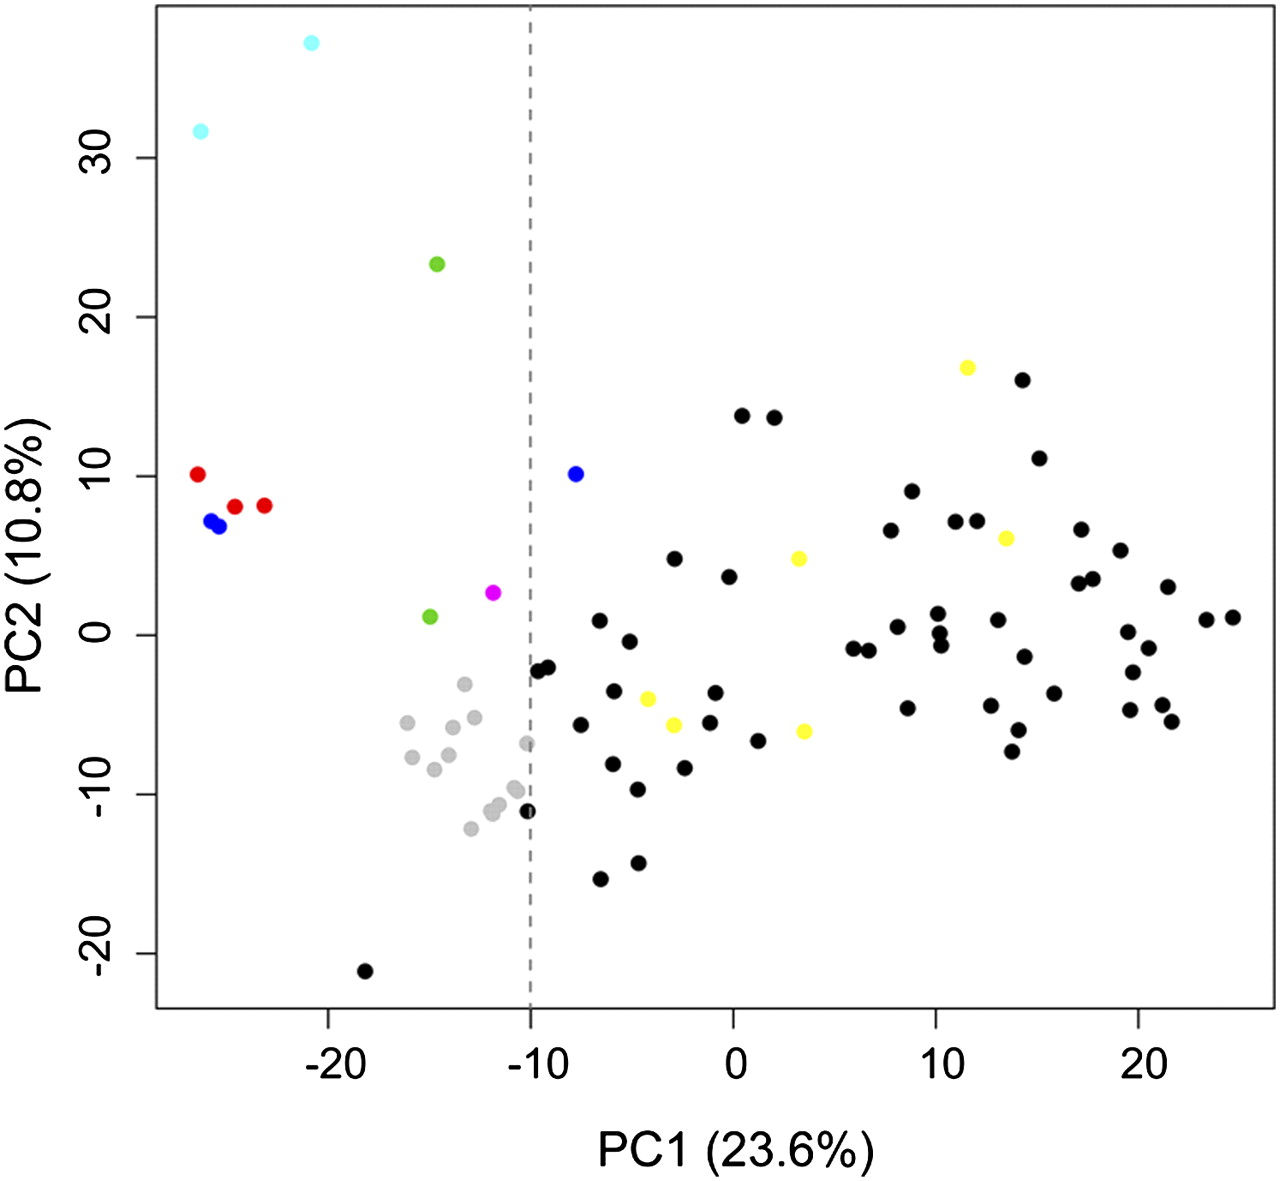
Figure 7.
Principal component analysis (PCA) of aCGH data. The first two principal components are shown on the axes, with their associated percentage of explained variation. Strains are shown as dots, colored by industrial source: bread strains (dark blue); lab strain (fuchsia); ale strains (light blue); fuel strains (green); “bread-like” commercial wine strains (red); PDM family commercial wine strains (gray); all other commercial wine strains (black); and “wild” wine strains (yellow). Dotted line extending vertically from X = −10 shows approximate cutoff of non-wine and wine strains.


