
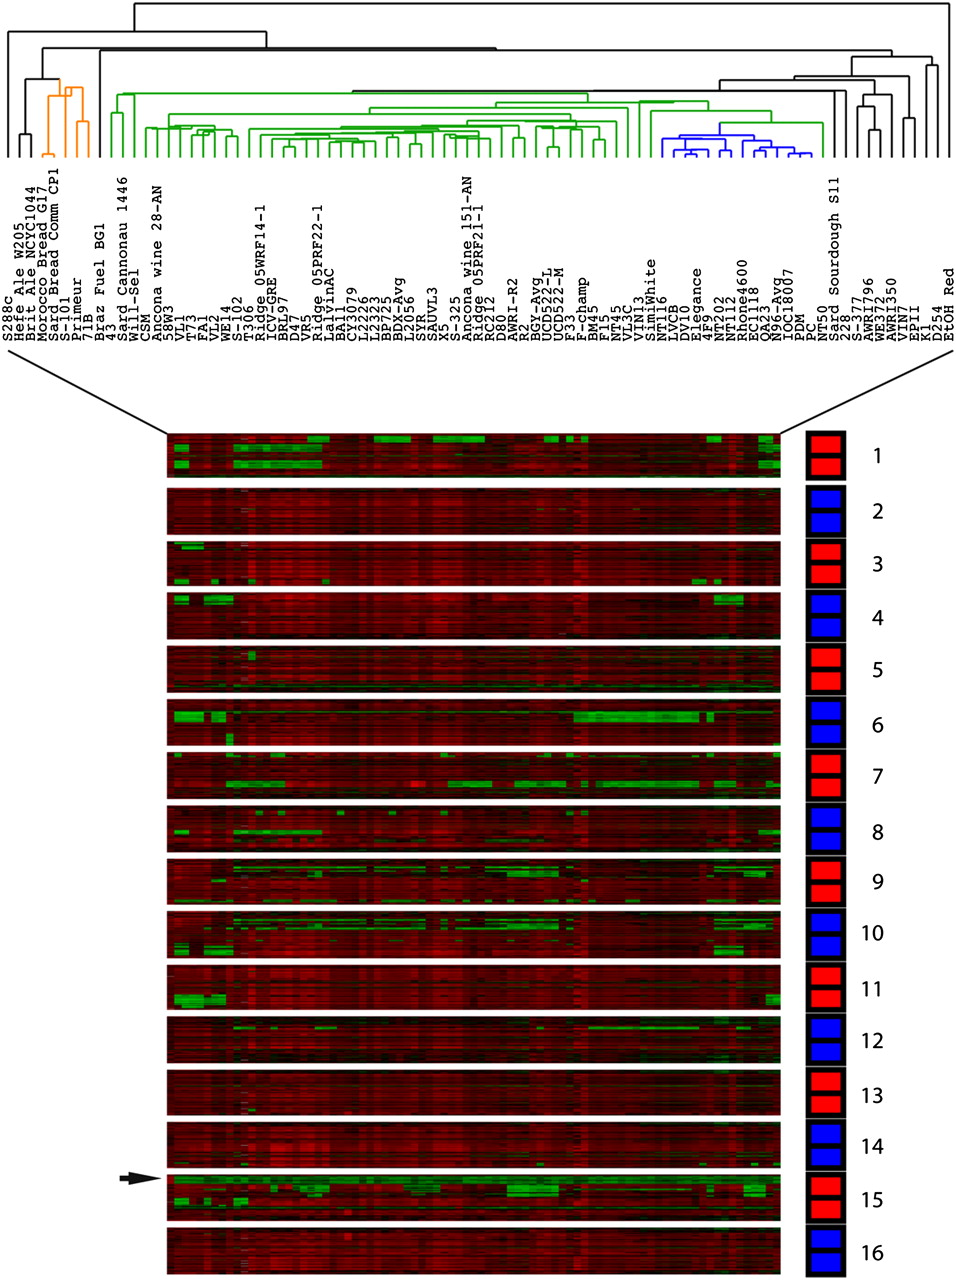
aCGH results for subtelomeric regions. aCGH data for probes from the S288c genome within 30 kb of the end of each chromosome are shown in order, from the chromosome 1 left telomere to the chromosome 16 right telomere, from top to bottom, with separation between each chromosome. Note that for each chromosome the top half represents the first 30 kb of the left end (in order of chromosomal position), and likewise, the bottom half represents the 30 kb of the right end (again in order of chromosomal position); the split between left end and right end probes is shown by a black horizontal line within the red or blue bar on the right that indicates the chromosome. Hierarchical clustering, using only these subtelomeric probes, was performed, with the generated dendrogram shown at top. Different clusters are highlighted as discussed in text. (Red and green bars) Increased and decreased relative hybridization to the probes, respectively.


