
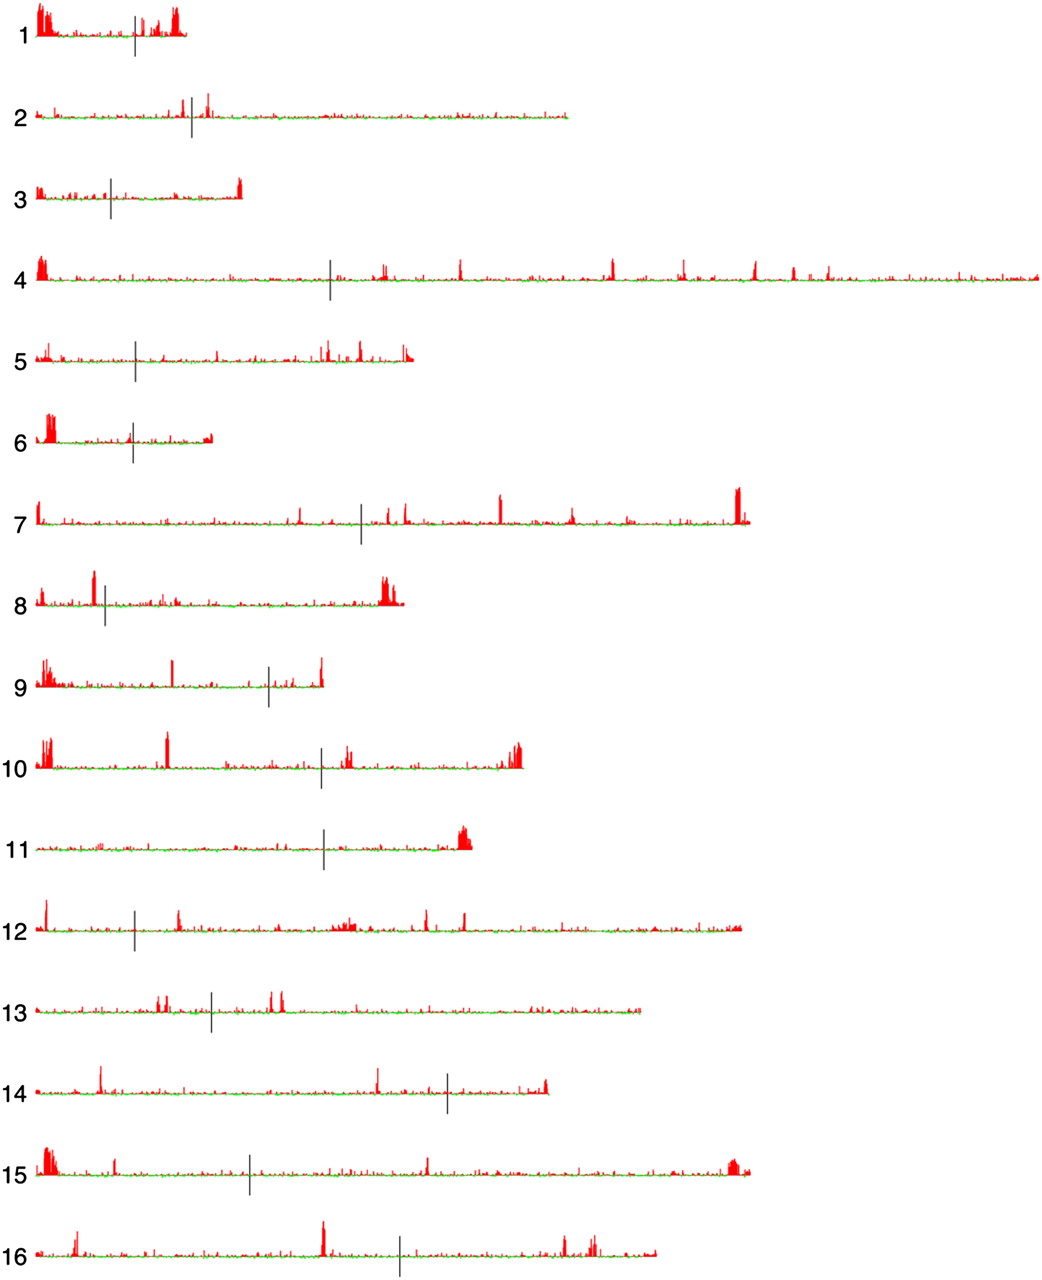
Figure 3.
Variation in S. cerevisiae S288c probe hybridization by chromosomal location. Standard deviations of hybridization ratios of S288c nuclear genome probes across all 83 strains were calculated, mean-centered, and plotted onto the S. cerevisiae chromosomal map using the program Caryoscope (Awad et al. 2004). (Left) Chromosome numbers; (vertical black lines) position of centromeres. (Red bars) Positive SD values, proportional to length; (green bars) negative SD values, proportional to length.


