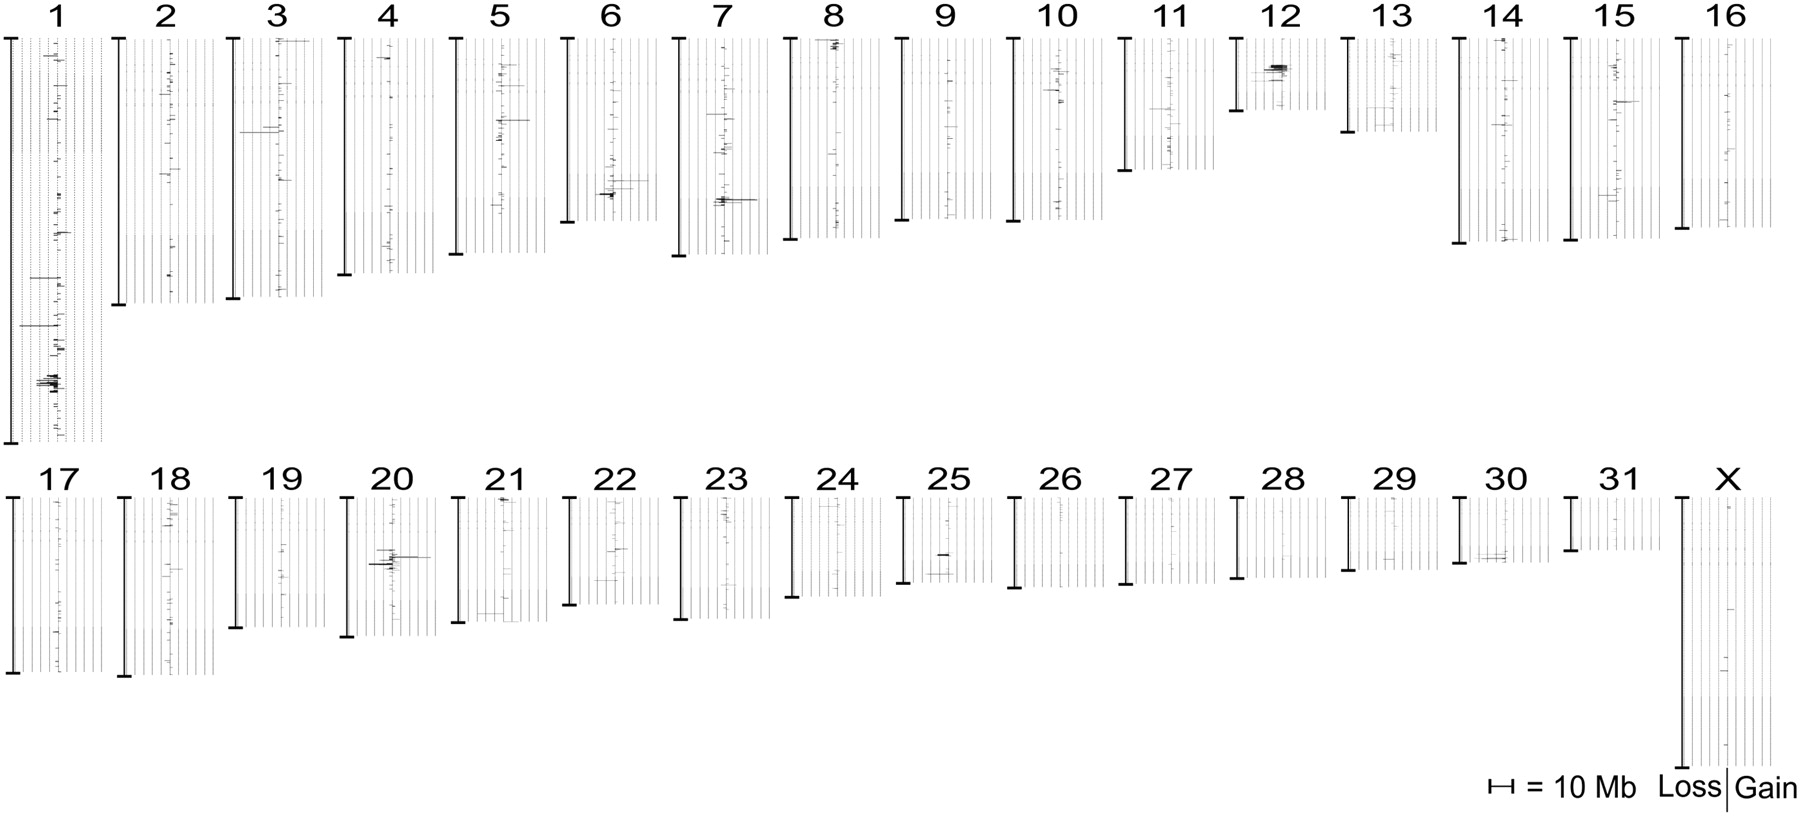
Identification of copy number variants in horses

(Downloading may take up to 30 seconds. If the slide opens in your browser, select File -> Save As to save it.)

Click on image to view larger version.

Figure 2.
Figure 2.

Distribution of CNVs in the horse genome. The bars on left indicate losses relative to the reference Thoroughbred, while those on the right indicate gains. The increase in bar length indicates an increase in number of samples sharing the CNV.

This Article

  1. Genome Res. 22: 899-907

Preprint Server