
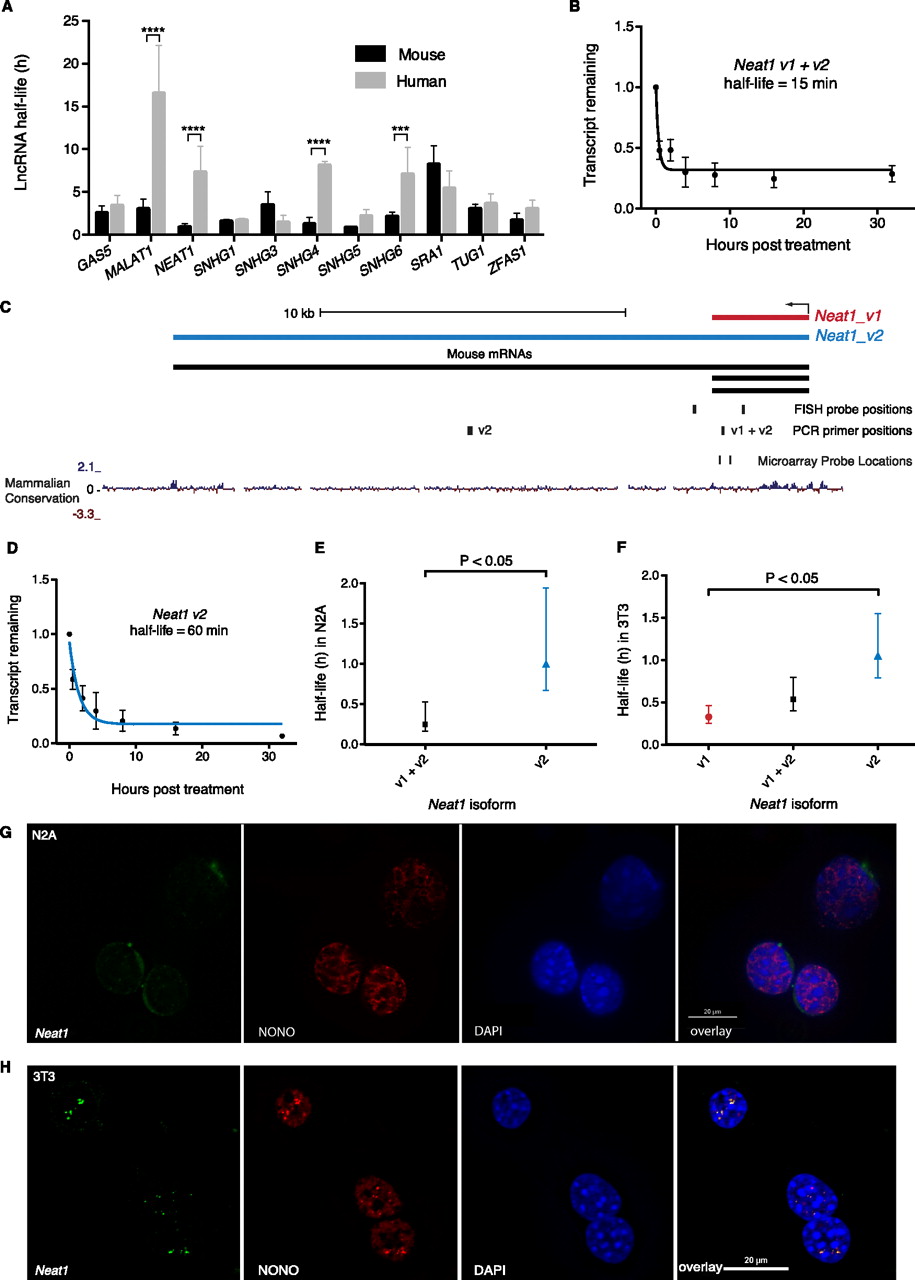
Neat1 stability. (A) Comparison of lncRNA stabilities in mouse and human from Friedel et al. (2009). Error bars are standard deviations. Significant differences determined by two-way ANOVA using Bonferroni multiple comparisons. (***) P < 0.001, (****) P < 0.0001. (B) Transcript decay curve for Neat1 (both v1 and v2 isoforms) in N2A cells after blocking transcription with actinomycin D and measuring transcript remaining relative to Gapdh by qPCR. Four biological replicates. Error bars are standard deviations. Fit modeled by one-phase decay using nonlinear least squares regression. (C) Neat1 genomic locus showing v1 and v2 isoforms plus positions of PCR amplicons, FISH, and microarray probes. (D) Neat1_v2/ long isoform half-life in N2A cells, qPCR as per B. (E) Comparison of Neat1 (both v1 and v2 isoforms) (95% CI = 10–32 min) and Neat1_v2/ long isoform (95% CI = 40 min–1 h, 57 min) in N2A cells. Error bars show 95% confidence intervals. Unpaired t-test. (F) Comparison of stability of Neat1 isoforms in 3T3 cells. qPCR from three biological replicates. Error bars show 95% confidence intervals. Unpaired t-test. (G,H) Combined RNA protein FISH on N2A cells (G) and 3T3 cells (H). (Left panel) Neat1 RNA; (second panel) localization of paraspeckle protein NONO; (third panel) DAPI nuclear stain; (final panel) overlay.


