
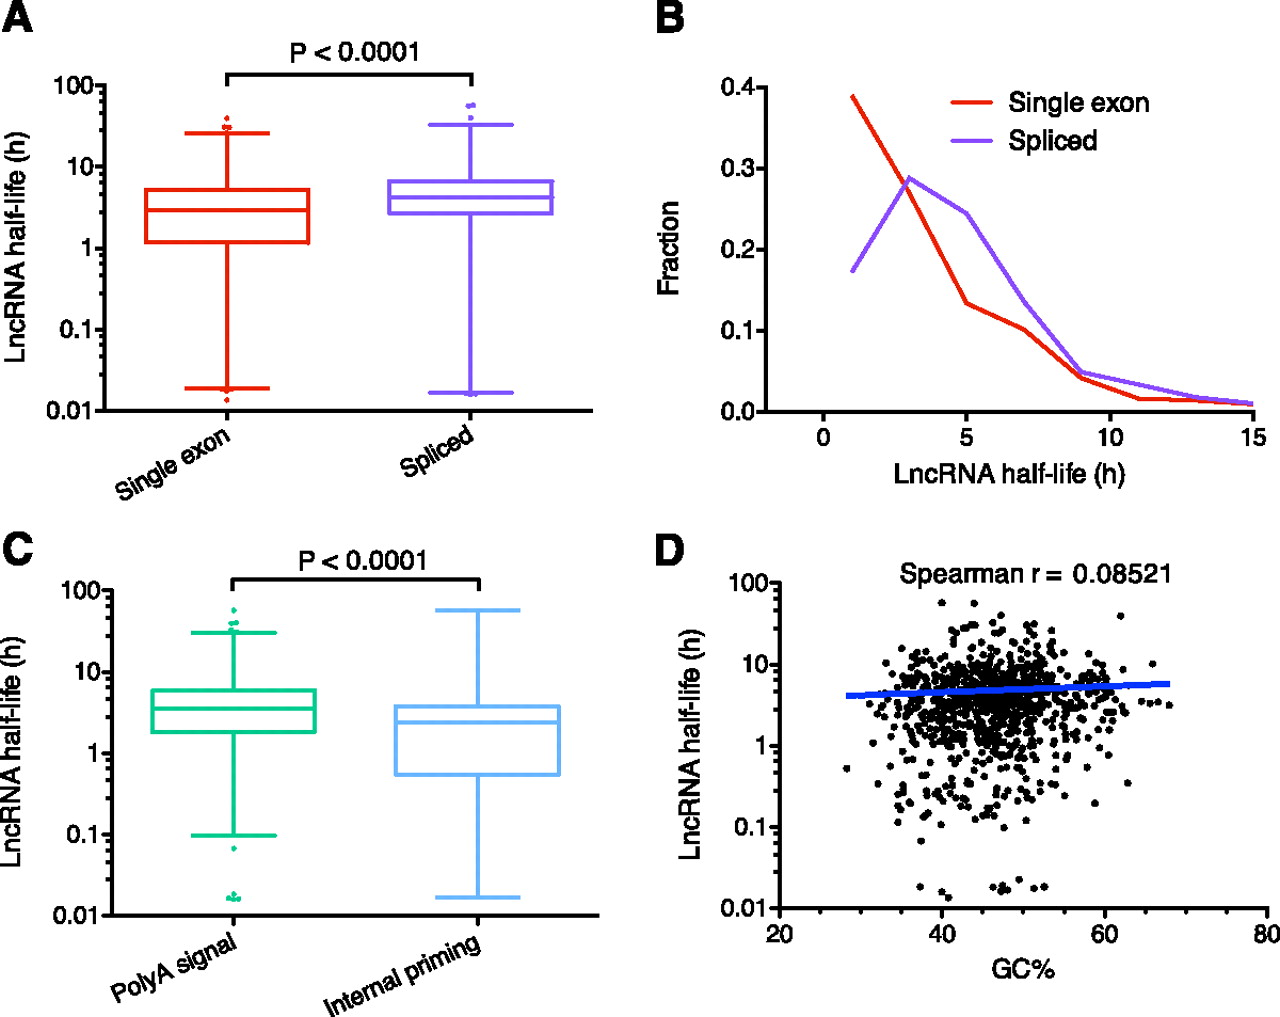
LncRNAs and decay elements. (A) Comparison of the stability of single exon versus spliced lncRNAs. Box-and-whisker plot. (Whiskers) 1st–99th percentile, with individual transcripts outside this shown as dots. (Box) 25th–75th percentile. Difference calculated using a nonparametric Mann-Whitney t-test. (B) Frequency distribution showing the fraction of single exon versus spliced lncRNAs in 2-h bins. Plotted points are at the center of the 2-h bin. Only time points with 1% or more of transcripts are plotted. (C) Comparison of the stability of lncRNAs containing a major or minor polyA signal versus those with evidence of internal priming. Box-and-whisker plot and statistical testing as per A. (D) Correlation between GC% and lncRNA half-life. Spearman correlation = 0.0852 (P = 0.0145) indicates a small positive relationship between increased half-life and lncRNAs with higher GC%. Spearman correlation utilized because data is non-Gaussian. Trend line shows a semilog fit from nonlinear regression. Axes are log10-linear.


