
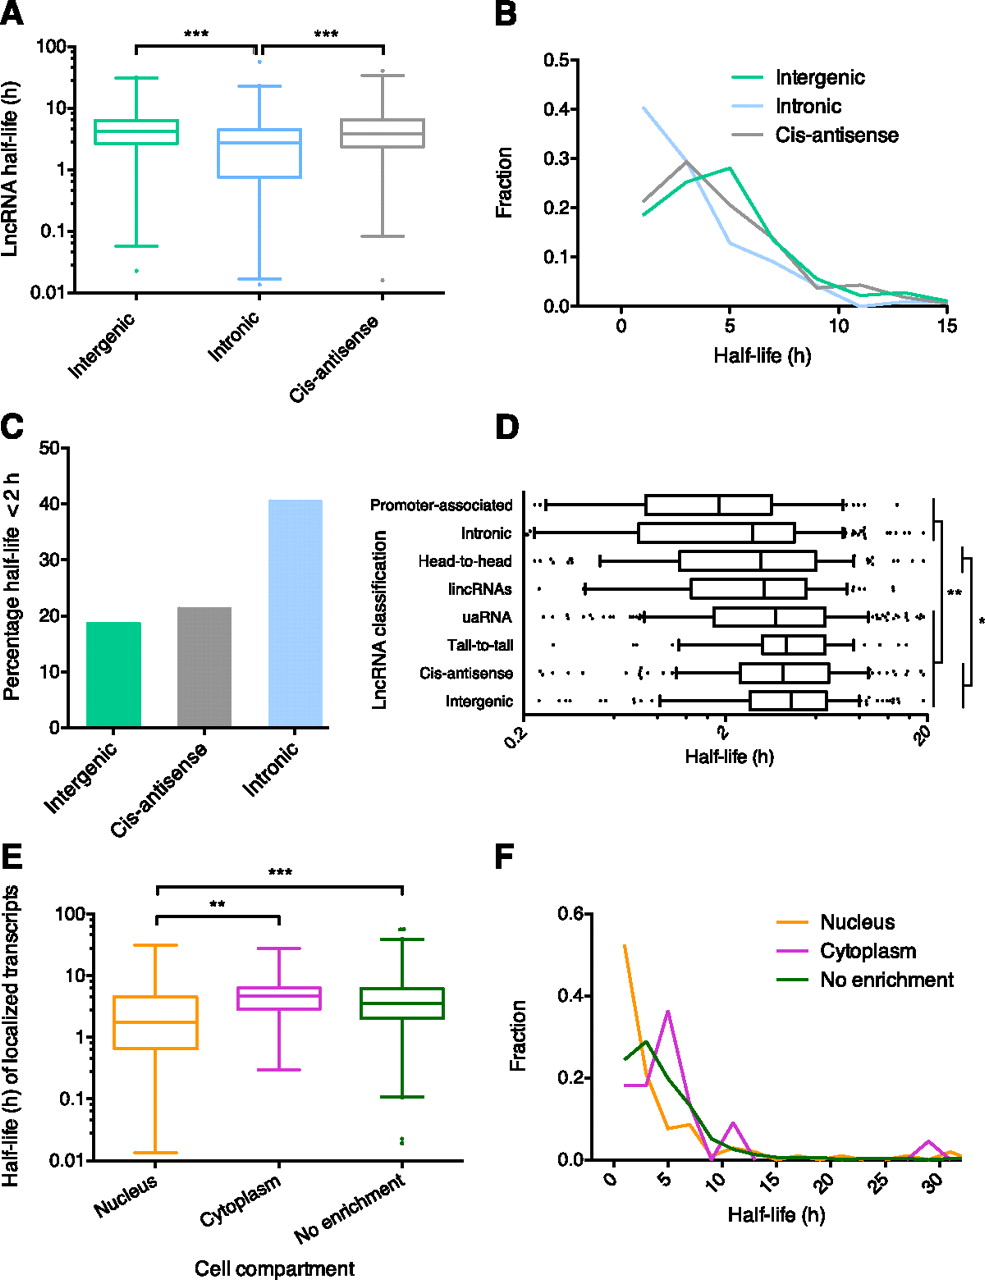
Effect of lncRNA features on stability. (A) Comparison of the stability of intronic versus intergenic and cis-antisense lncRNAs. Box-and-whisker plot. (Whiskers) 1st–99th percentile, with individual transcripts outside this shown as dots. (Box) 25th–75th percentile. Difference calculated using one-way ANOVA with Kruskal-Wallis nonparametric test and Dunn's post-test to compare individual annotations. (B) Frequency distribution showing the fraction of lncRNA transcripts in 2-h bins. Plotted points are at the center of the 2-h bin. Only time points with 1% or more of transcripts are plotted. (C) Percentage of unstable (half-life under 2 h) lncRNA intergenic, cis-antisense, and intronic transcripts. Significant difference calculated using χ2 test. (D) Comparison of the stability of all lncRNA genomic classifications. Box-and-whisker plot. To focus on the center of the distribution, whiskers show 10th–90th percentile, with individual transcripts outside this shown as dots, and only half-lives between 0.2 h and 20 h are shown. Significant differences found between stability of classes using one-way ANOVA with Kruskal-Wallis nonparametric test and Dunn's post-test to compare individual annotations. (*) Level of significance common to all comparisons. (E) Comparison of the stability of localized transcripts. Box-and-whisker plot and statistical testing as per A. (F) Frequency distribution showing the fraction of nuclear, cytoplasmic, and nonenriched transcripts in 2-h bins. Plotted points as per B. (*) P < 0.05, (**) P < 0.01, (***) P < 0.001.


