
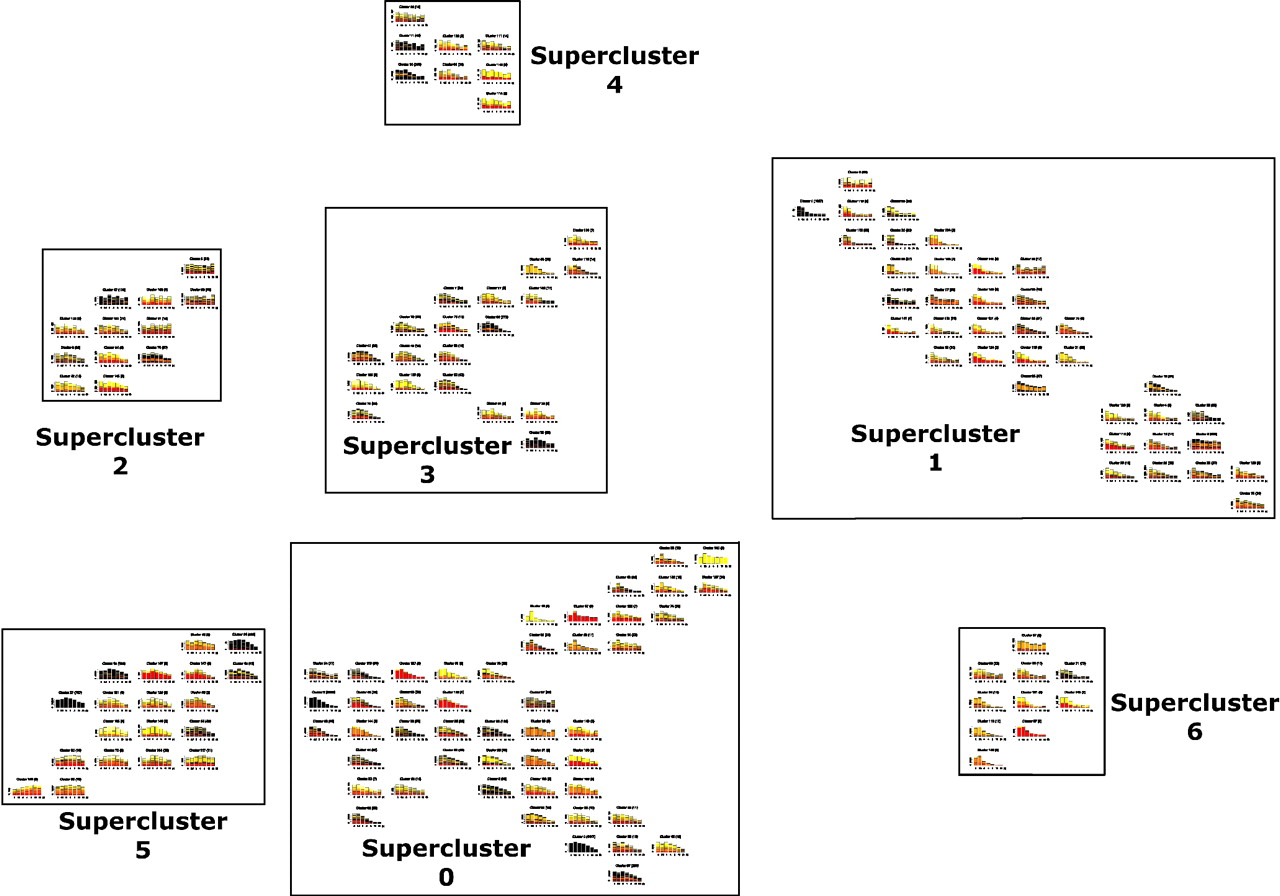
Distance-based clustering of transcript decay rates. Transcripts are automatically clustered; with those showing indistinguishable decay profiles over the time course present in the same cluster, while transcripts with similar profiles are found in nearby clusters. The physical distance between individual clusters and between super-clusters represents the degree of difference in the decay profile. Clusters of clusters or super-clusters are created by applying the method used to form the clusters to the clusters themselves. Title gives the cluster number and the number of probes in the cluster. (X-axis) Cumulative expression of all probes in the cluster. Decay profiles are stacked bar graphs with every stack representing a separate transcript; when there are many transcripts in a cluster, the expression level of some transcripts cannot be individually visualized and are seen as areas of black (representing many transcripts). An interactive version of this figure can be found at http://stability.matticklab.com/.


